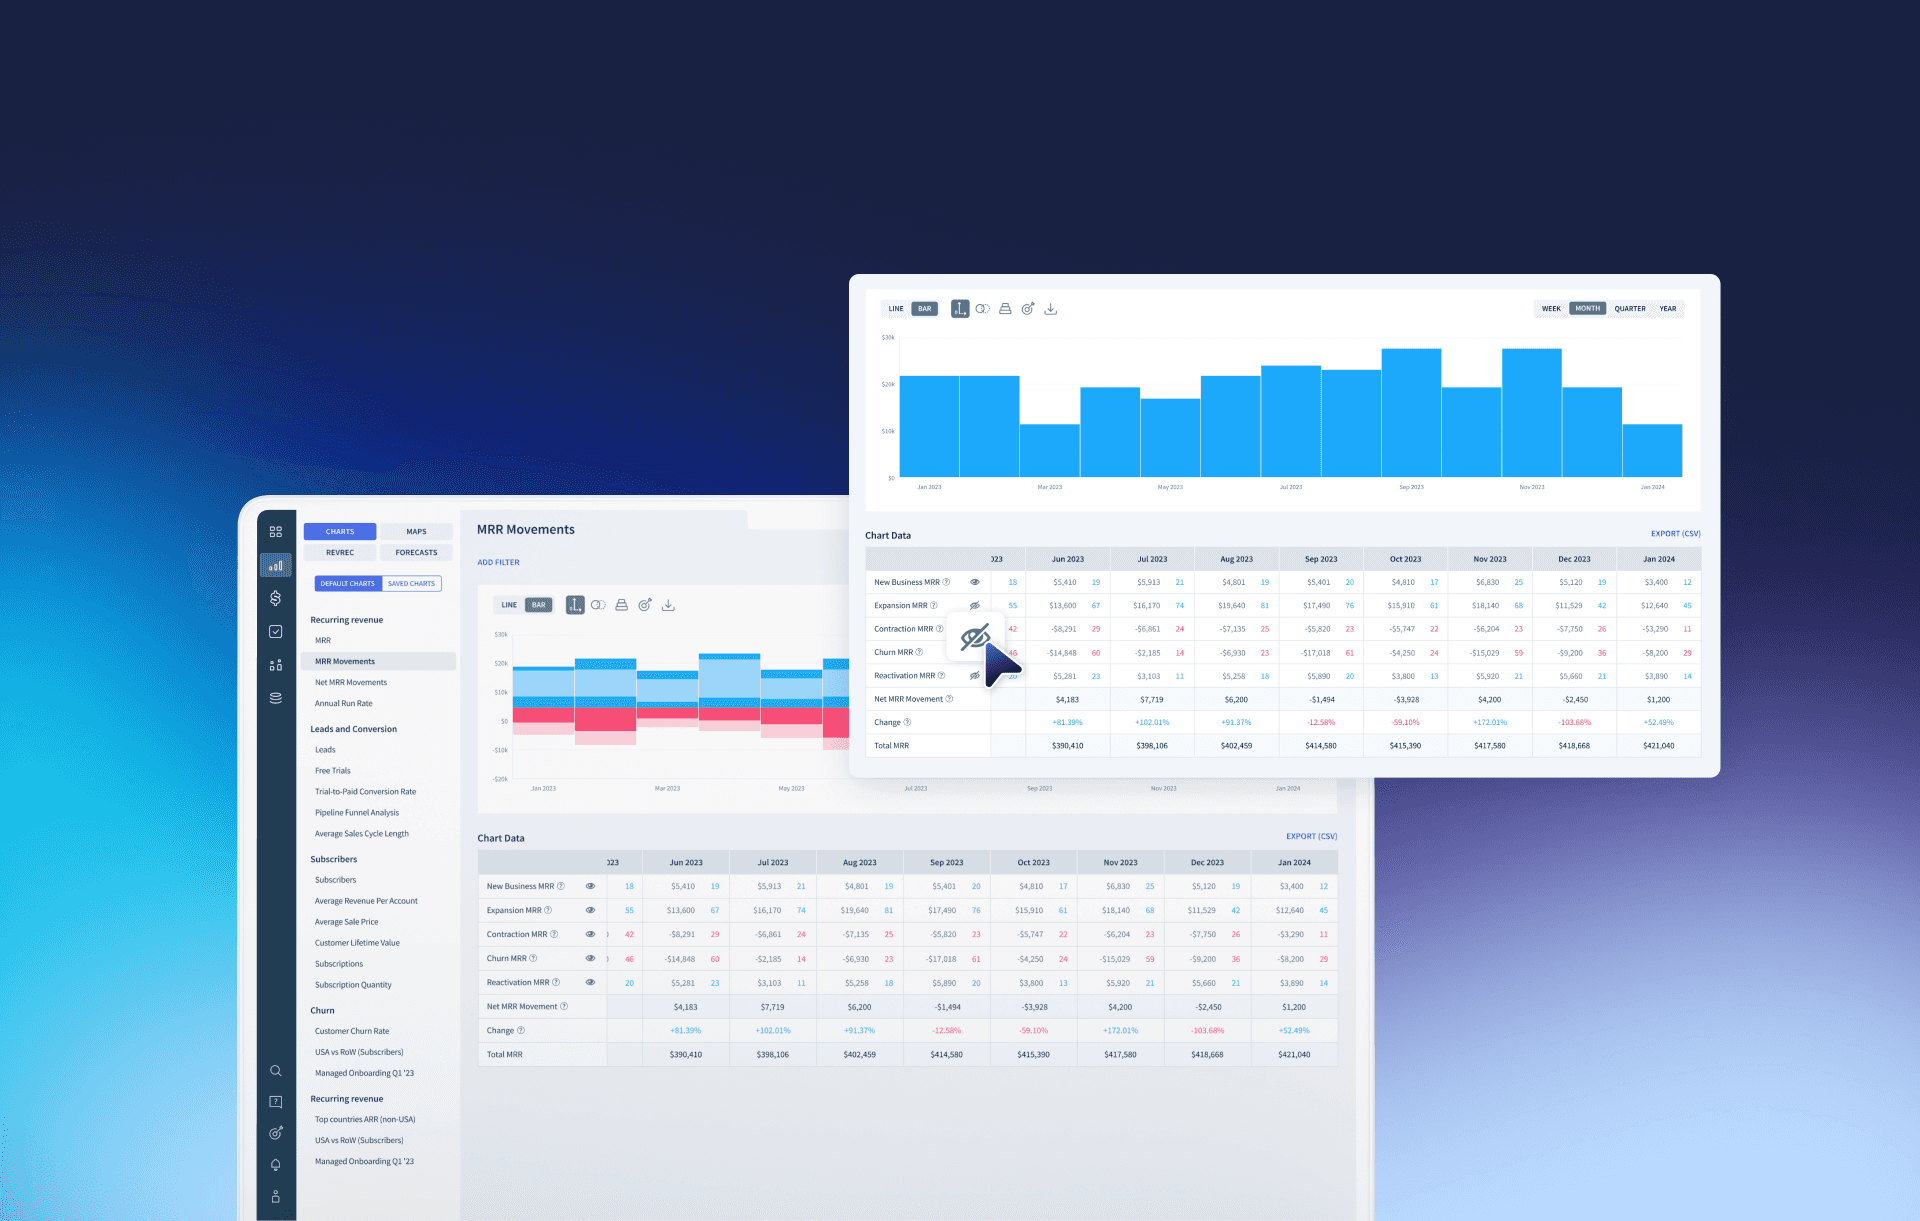
Customizable MRR Movement Chart
Period
2023.06 - 2023.08
Company
ChartMogul
Tools
Figma, Notion, Slack
Project Overview
Adding the ability to isolate specific MRR movements for clearer insights
ChartMogul's MRR Movements chart tracks changes in subscription revenue over time. To help users extract more precise insights, we added the ability to isolate and toggle specific MRR movement types, making it easier to focus on what matters most.
As the product designer, I led end-to-end process from gathering user feedback and proposing design solutions to coordinating the release schedule with engineering and marketing teams.
Context
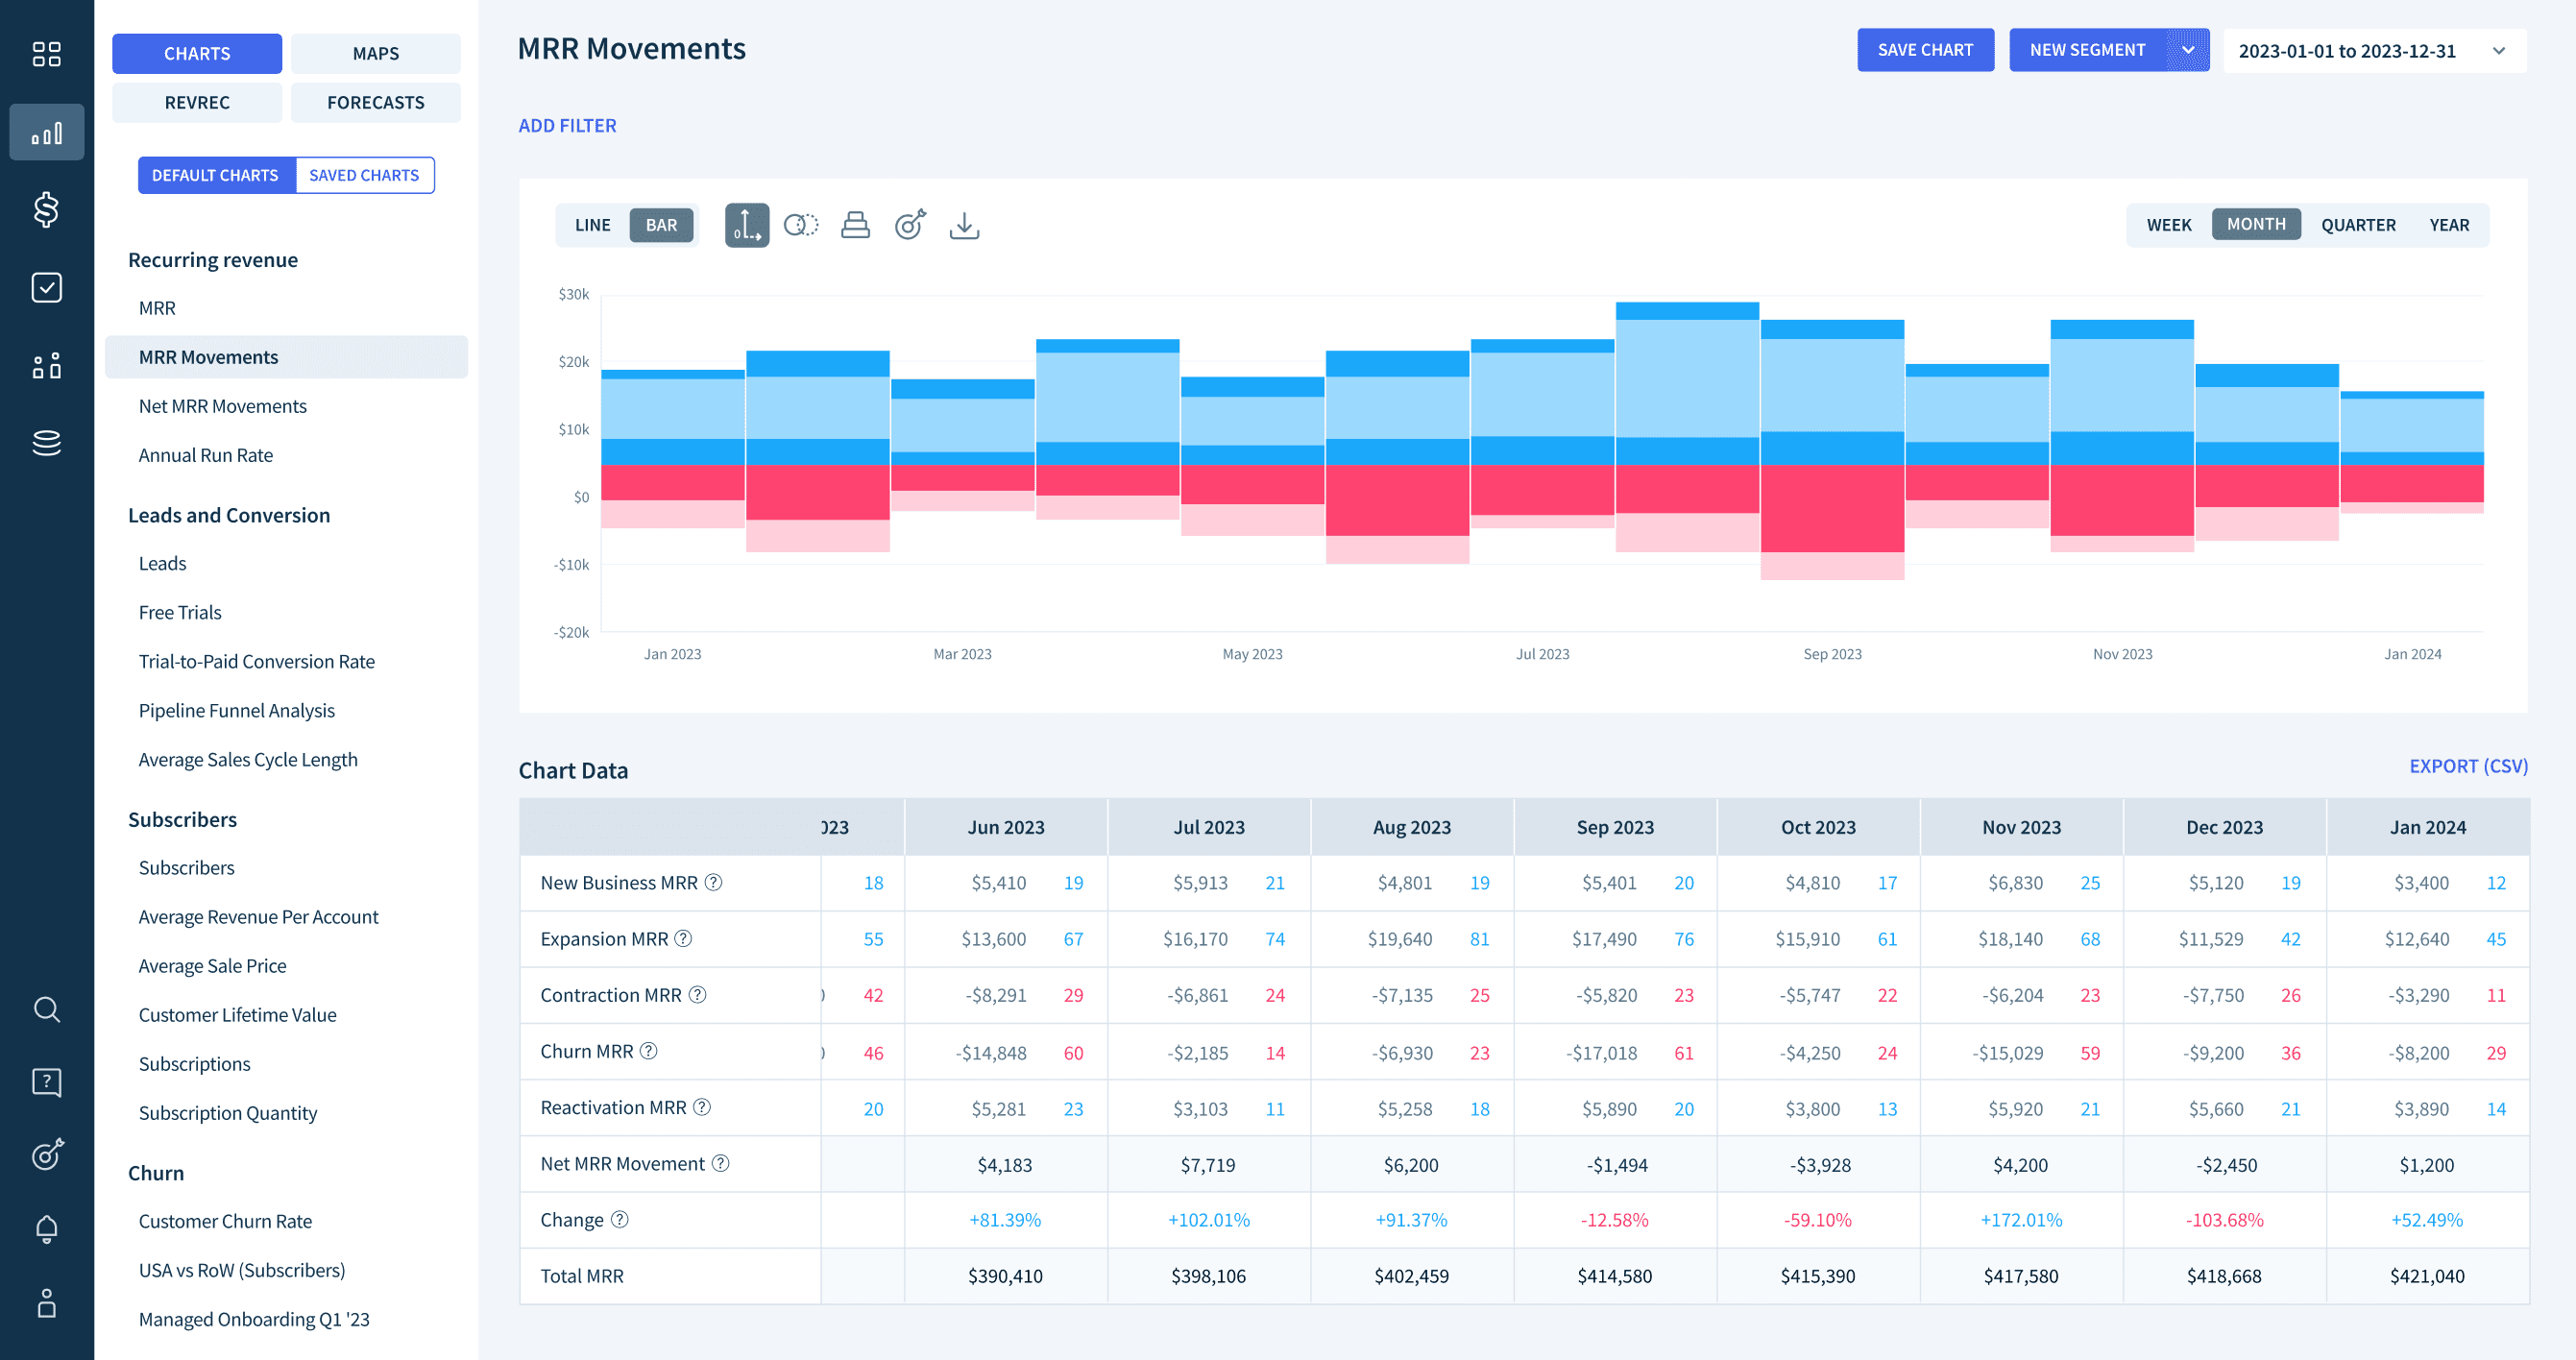
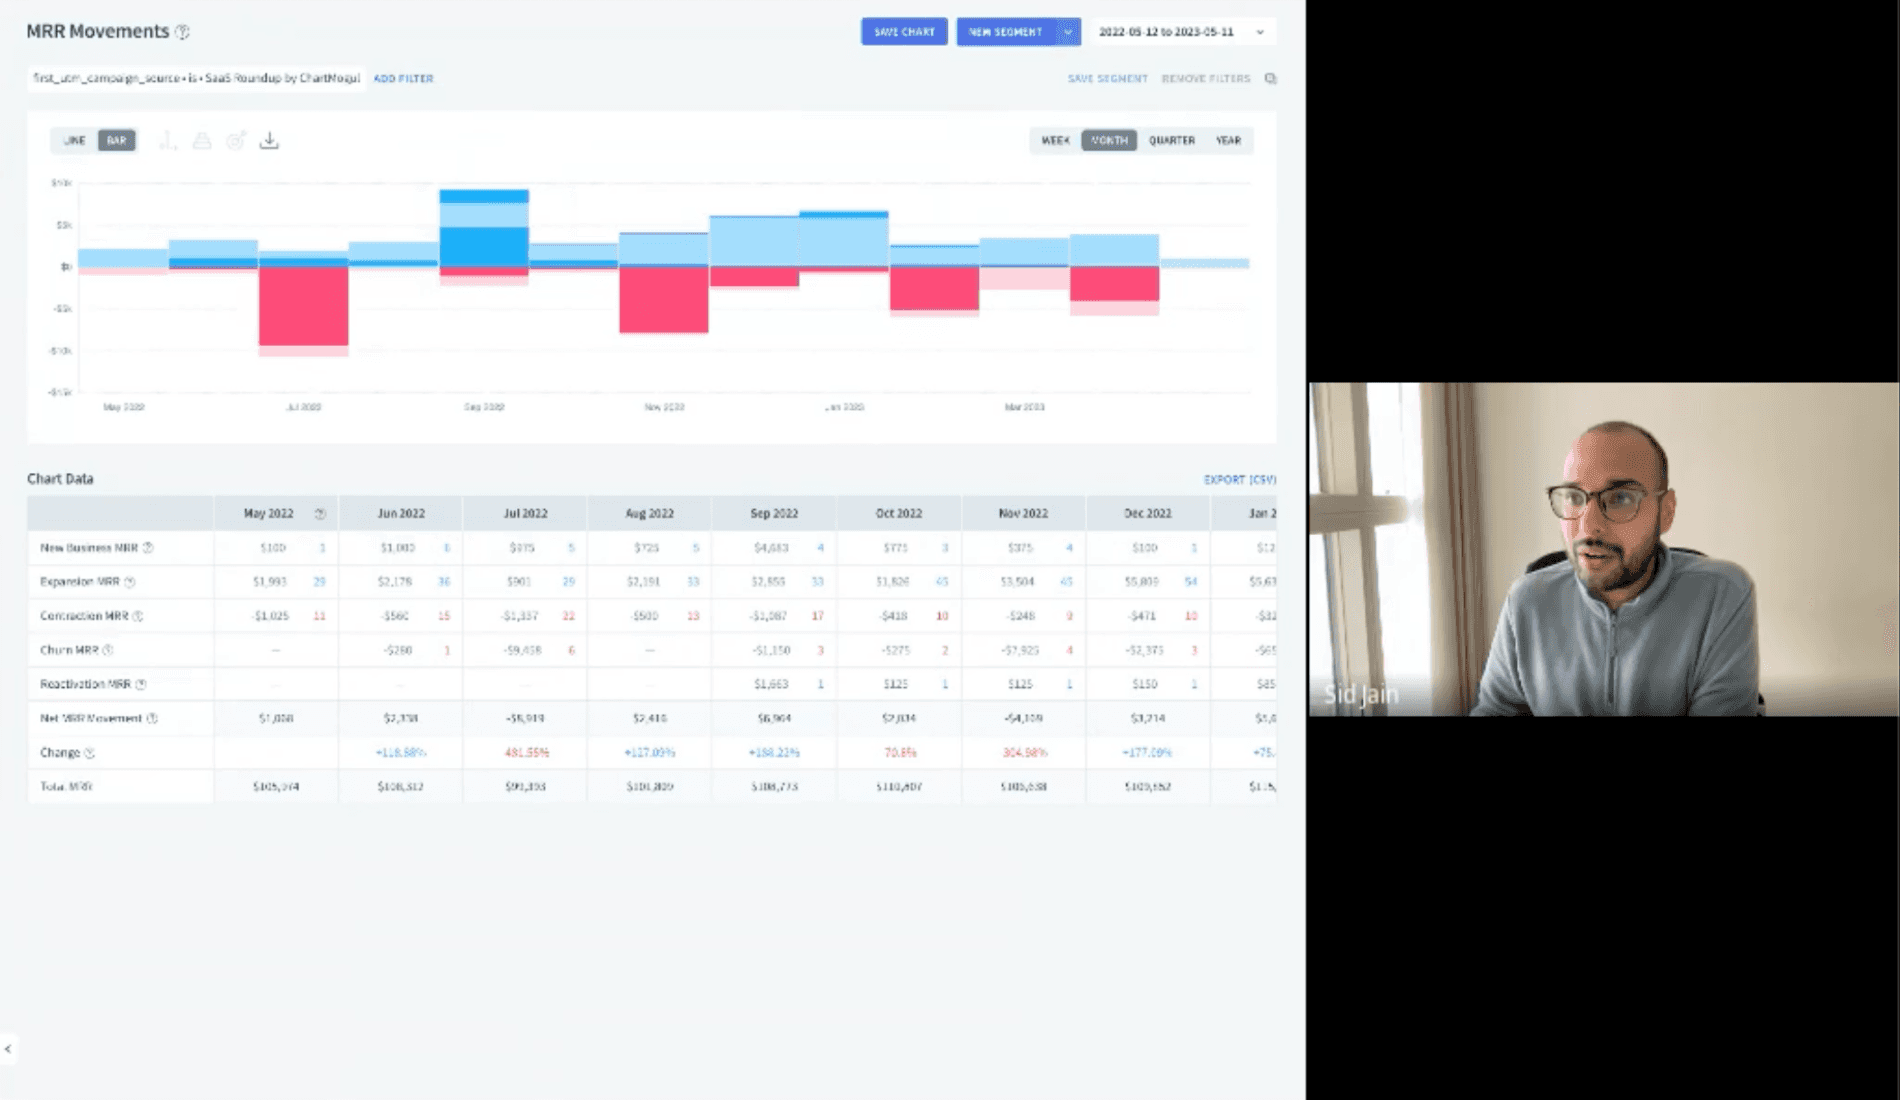
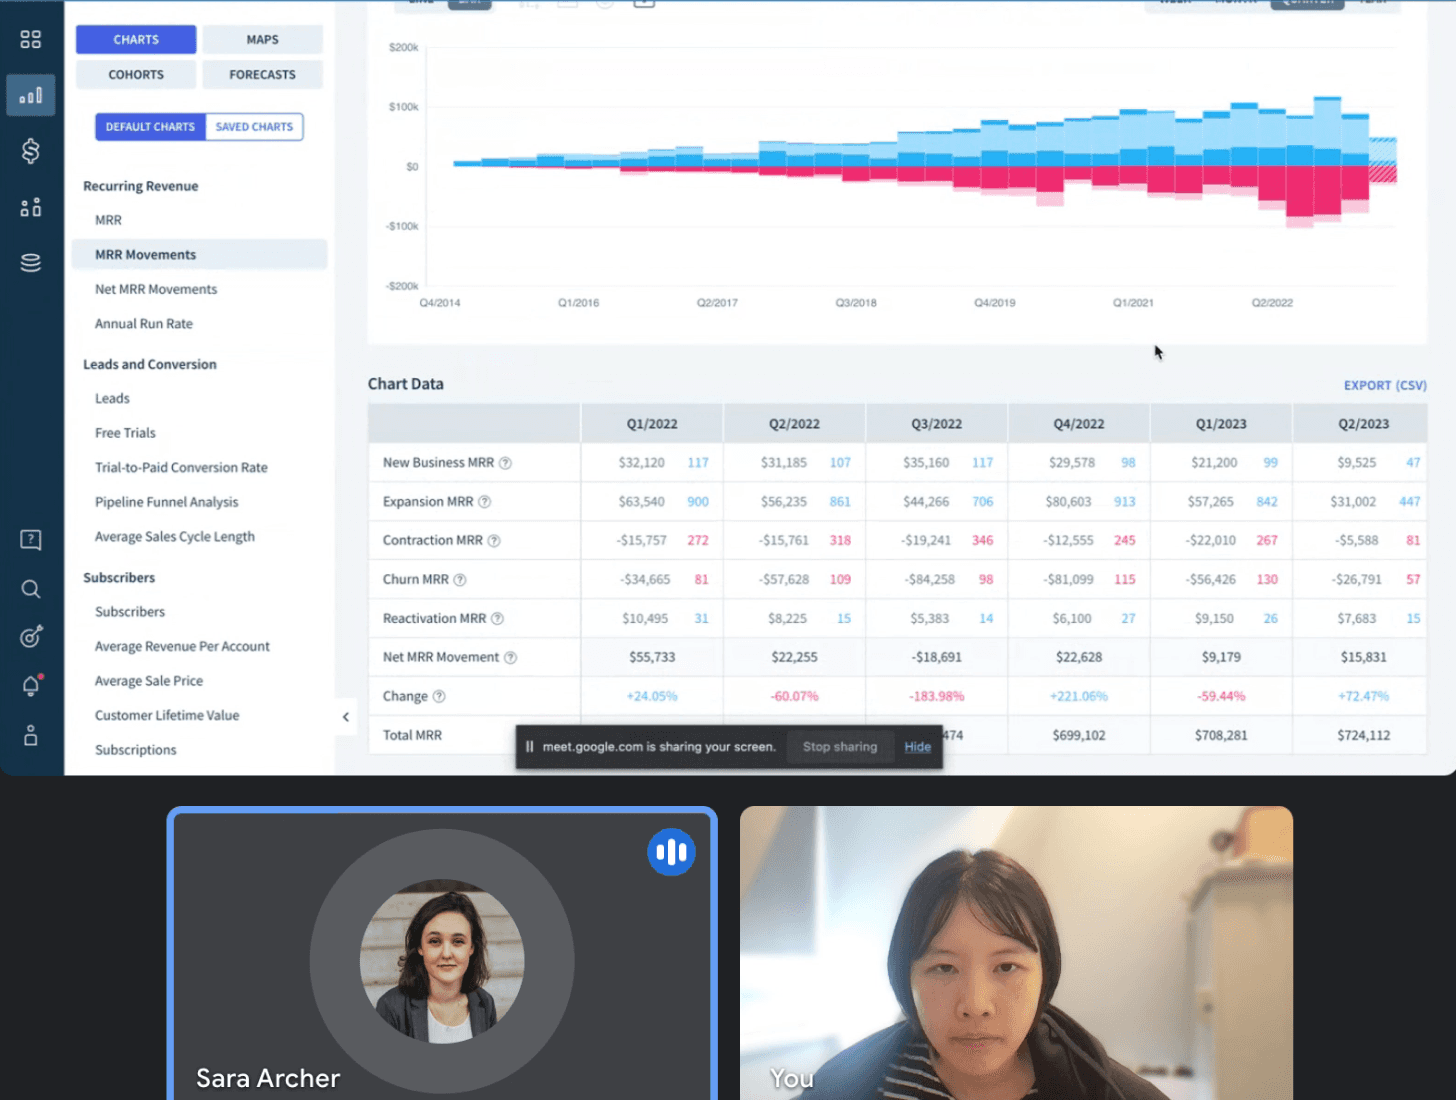
MRR Movements chart tracks how subscription revenue changes over time, broken down by movement type.
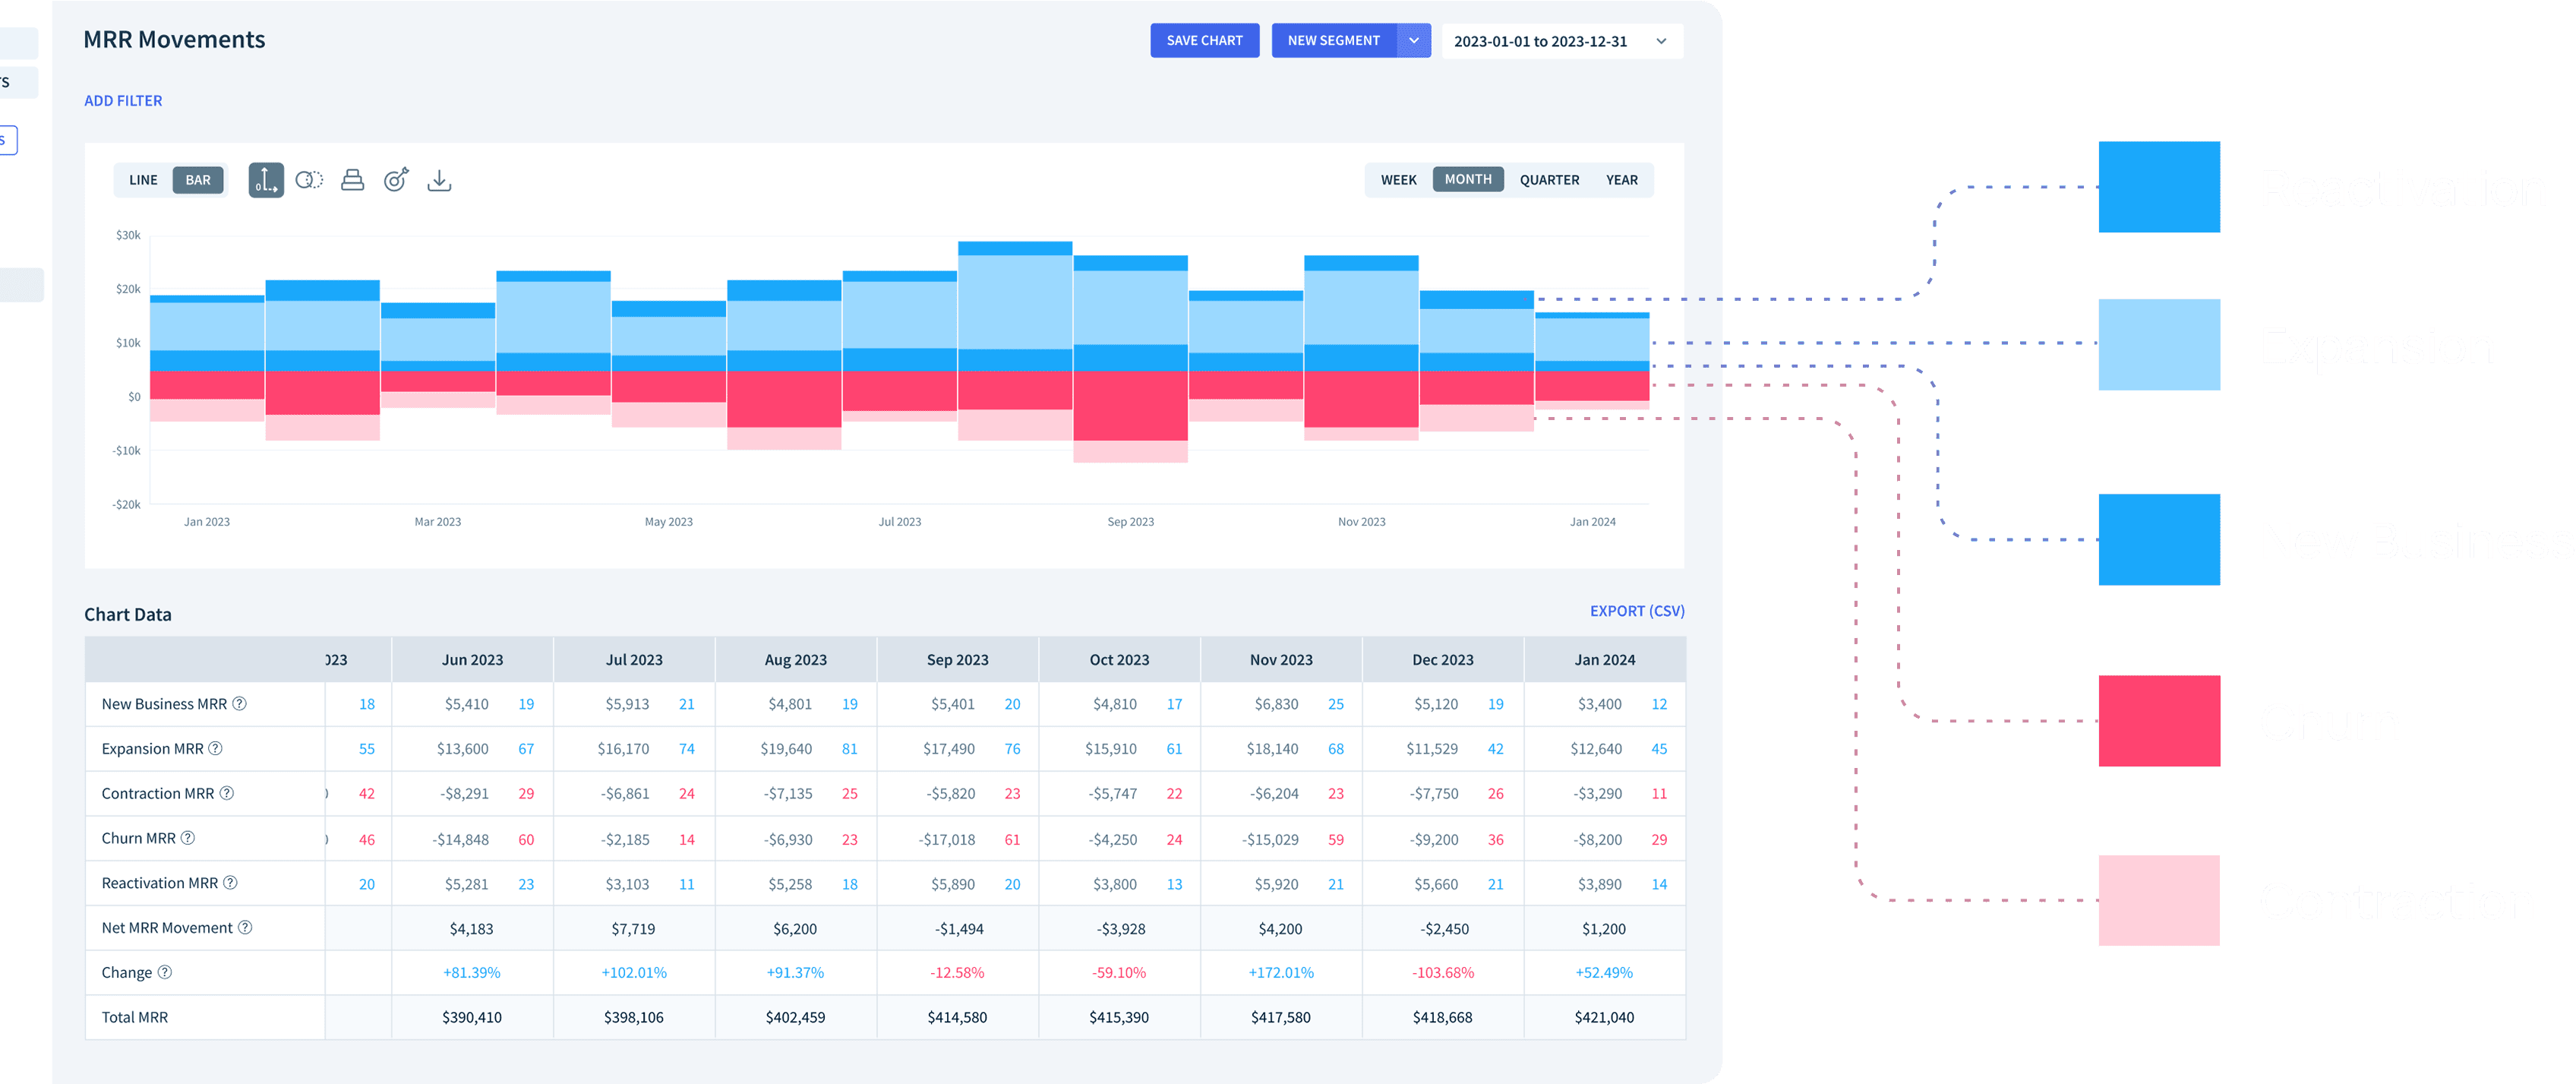
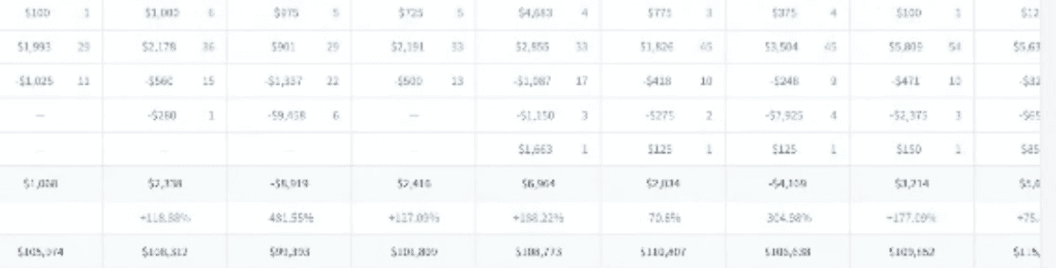
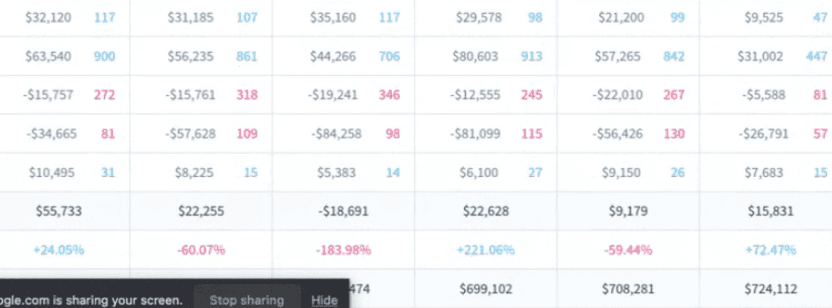
MRR Movements are stacked and color-coded by movement type. While this gives a comprehensive view, it makes it hard to focus on a specific movement without being distracted by the others.
(Blue = MRR growth · Pink = MRR loss)
Problem statement
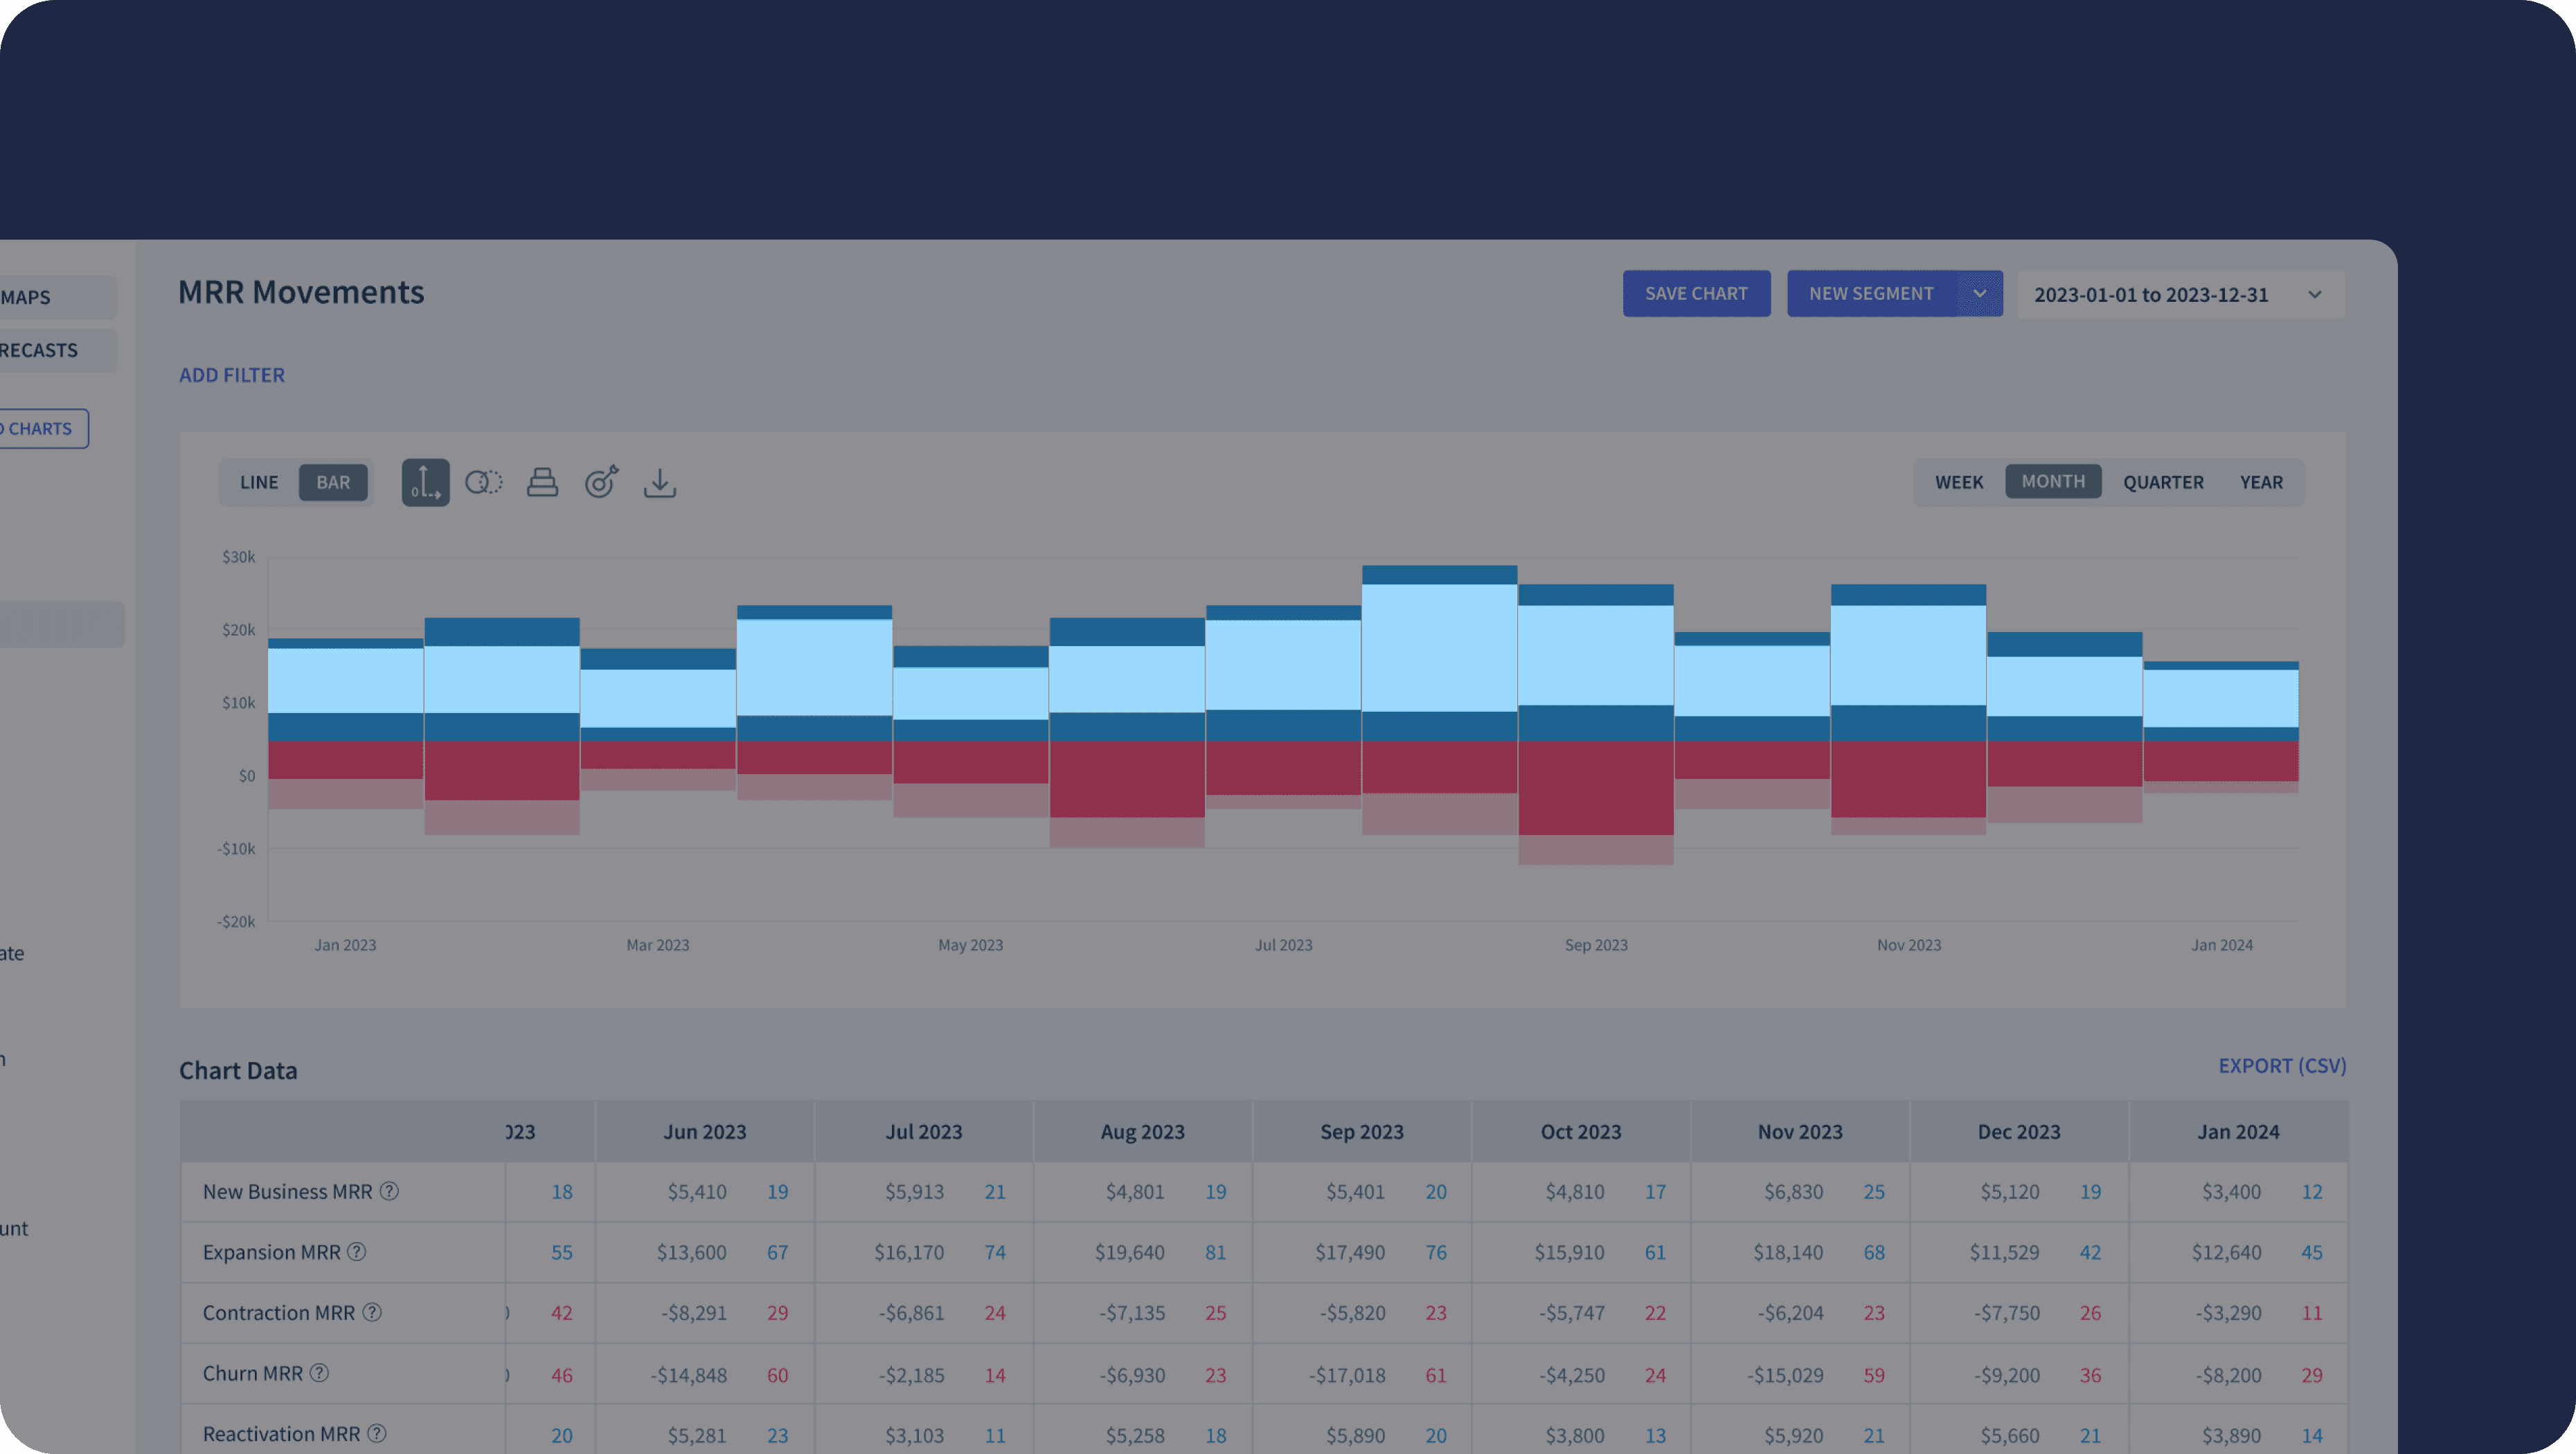
Users couldn't isolate specific MRR movement types, making it hard to extract the insights they actually needed.
The stacked visualization made it challenging to focus on individual movement types. When users wanted to analyze new business growth, for example, other movements in the stack got in the way.
How might we encourage users to get more useful insights into MRR Movements chart?
Goal
Enable users to isolate and toggle specific MRR movement types for clearer, more focused insights

NDA

NDA
User interview
Users struggled to focus on specific movements in the current stacked view.
I conducted interviews with internal team members actively using the MRR Movements chart for sales and marketing. They consistently expressed a need to view specific movement types without being influenced by others.
Ideate
I explored 3 UI options for toggling movement types, and 2 approaches for displaying isolated movements.
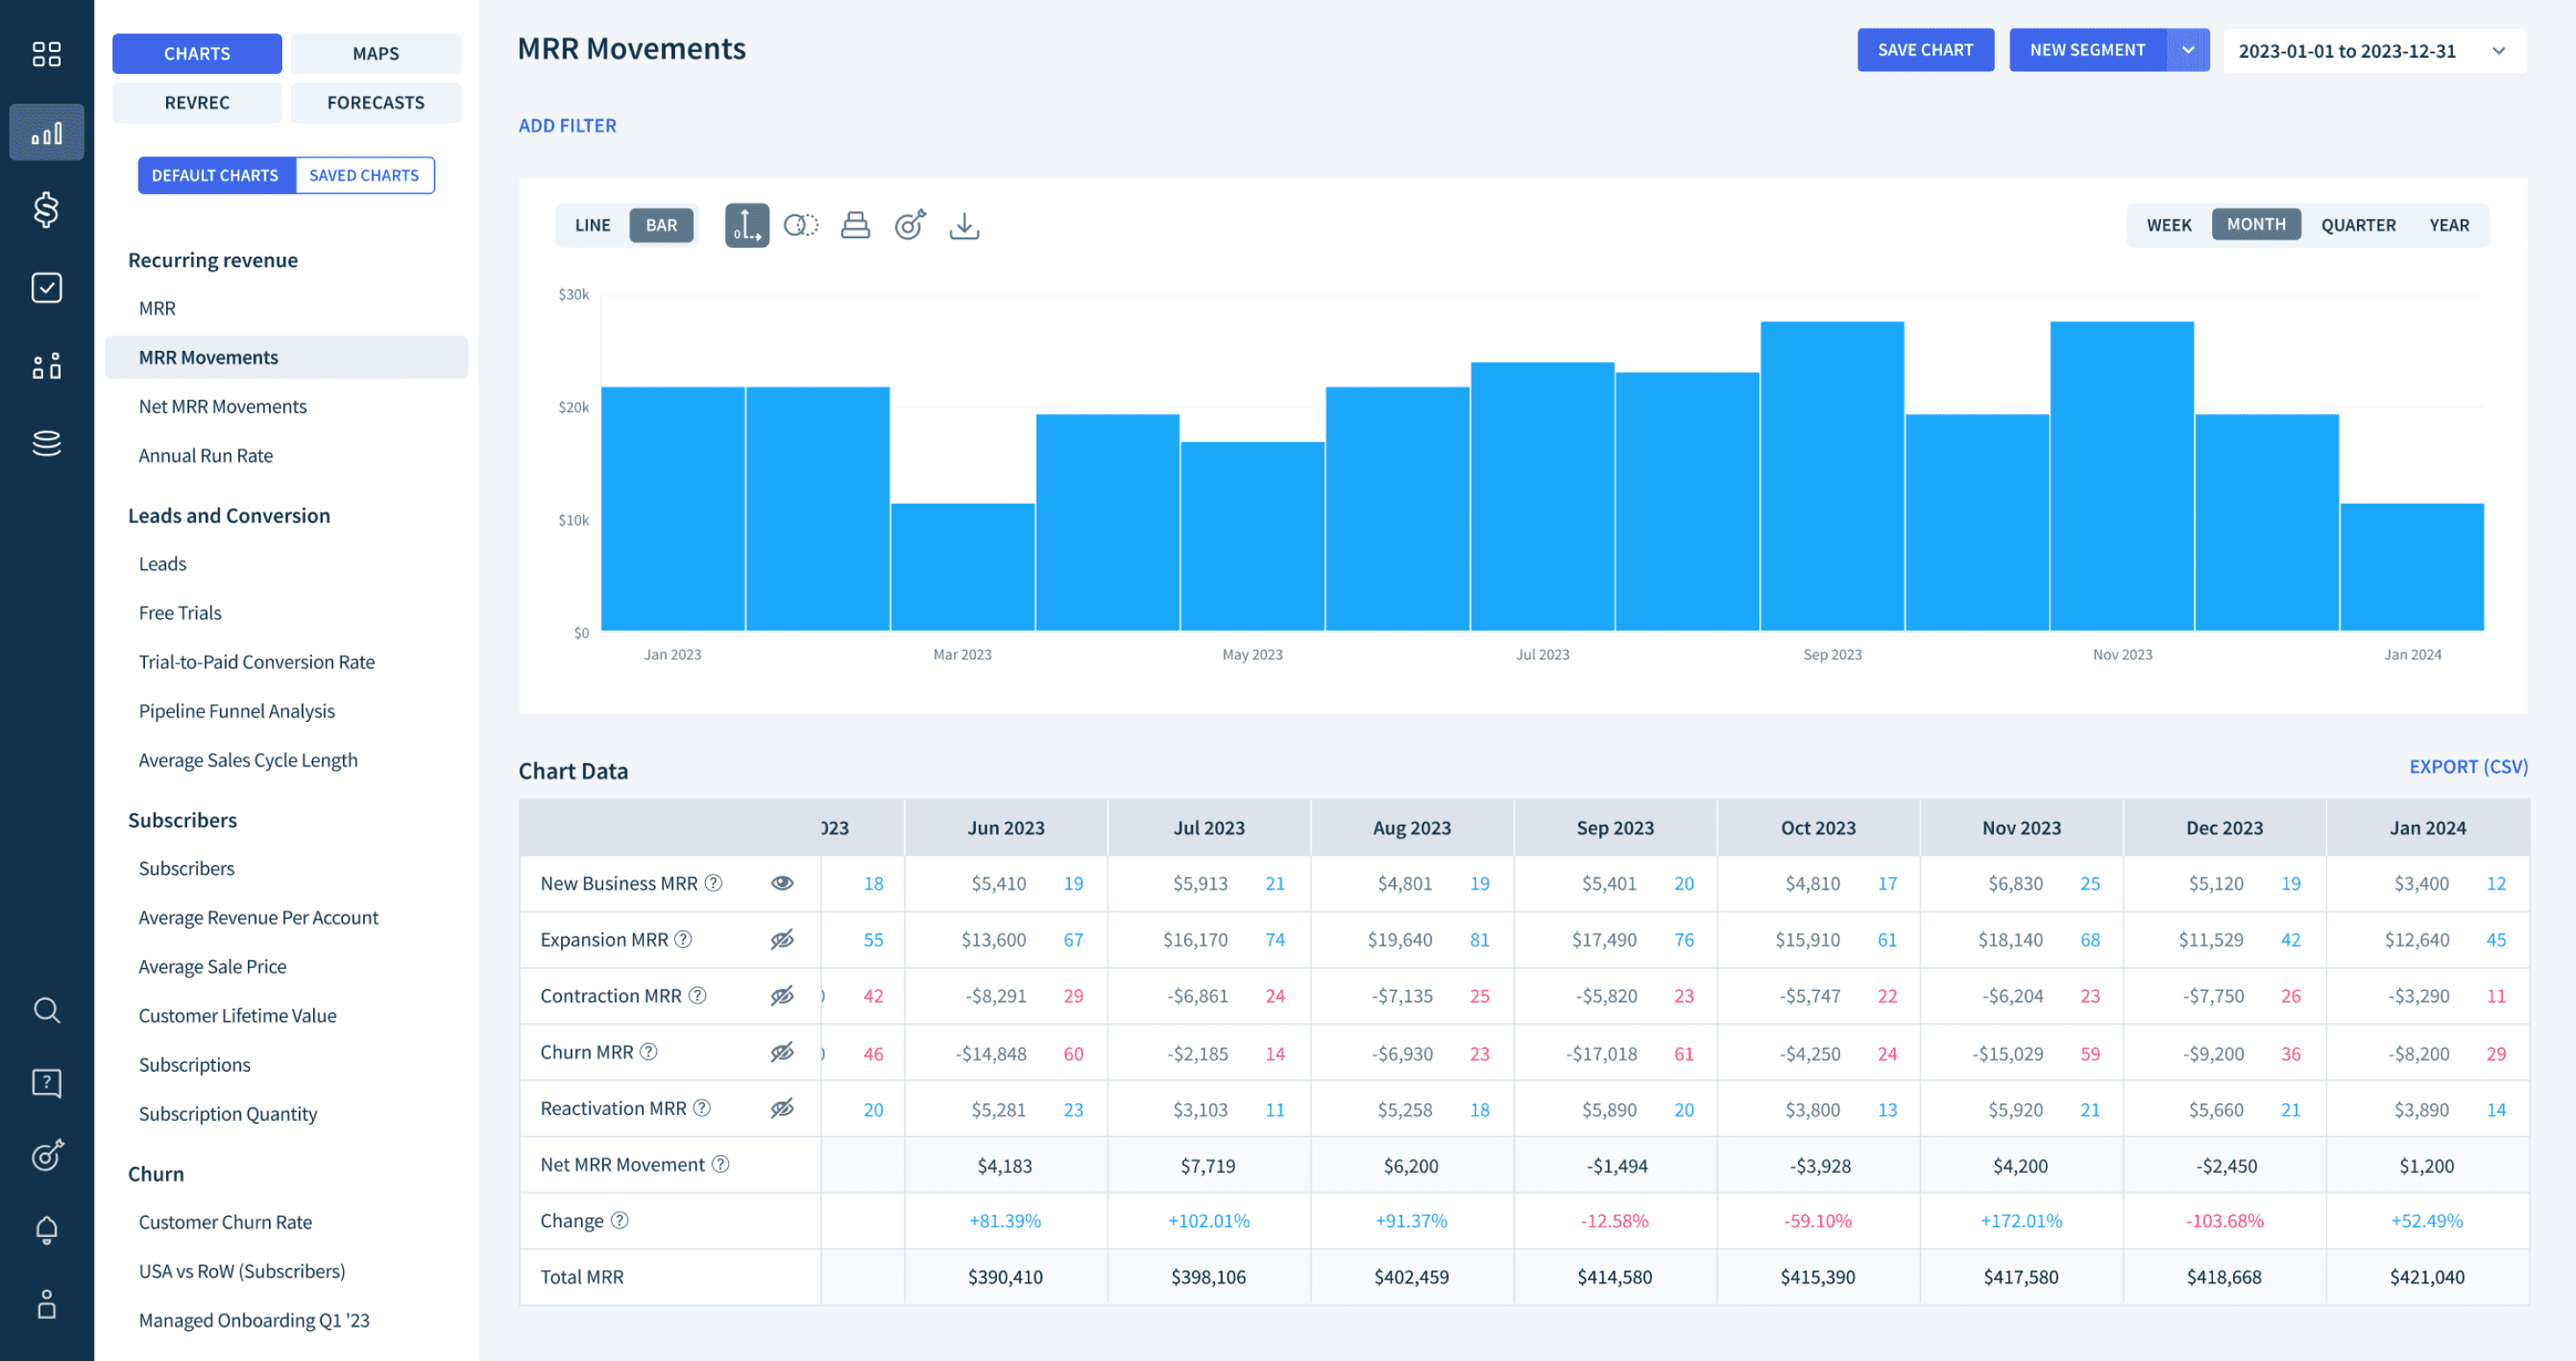
Eye icon switch
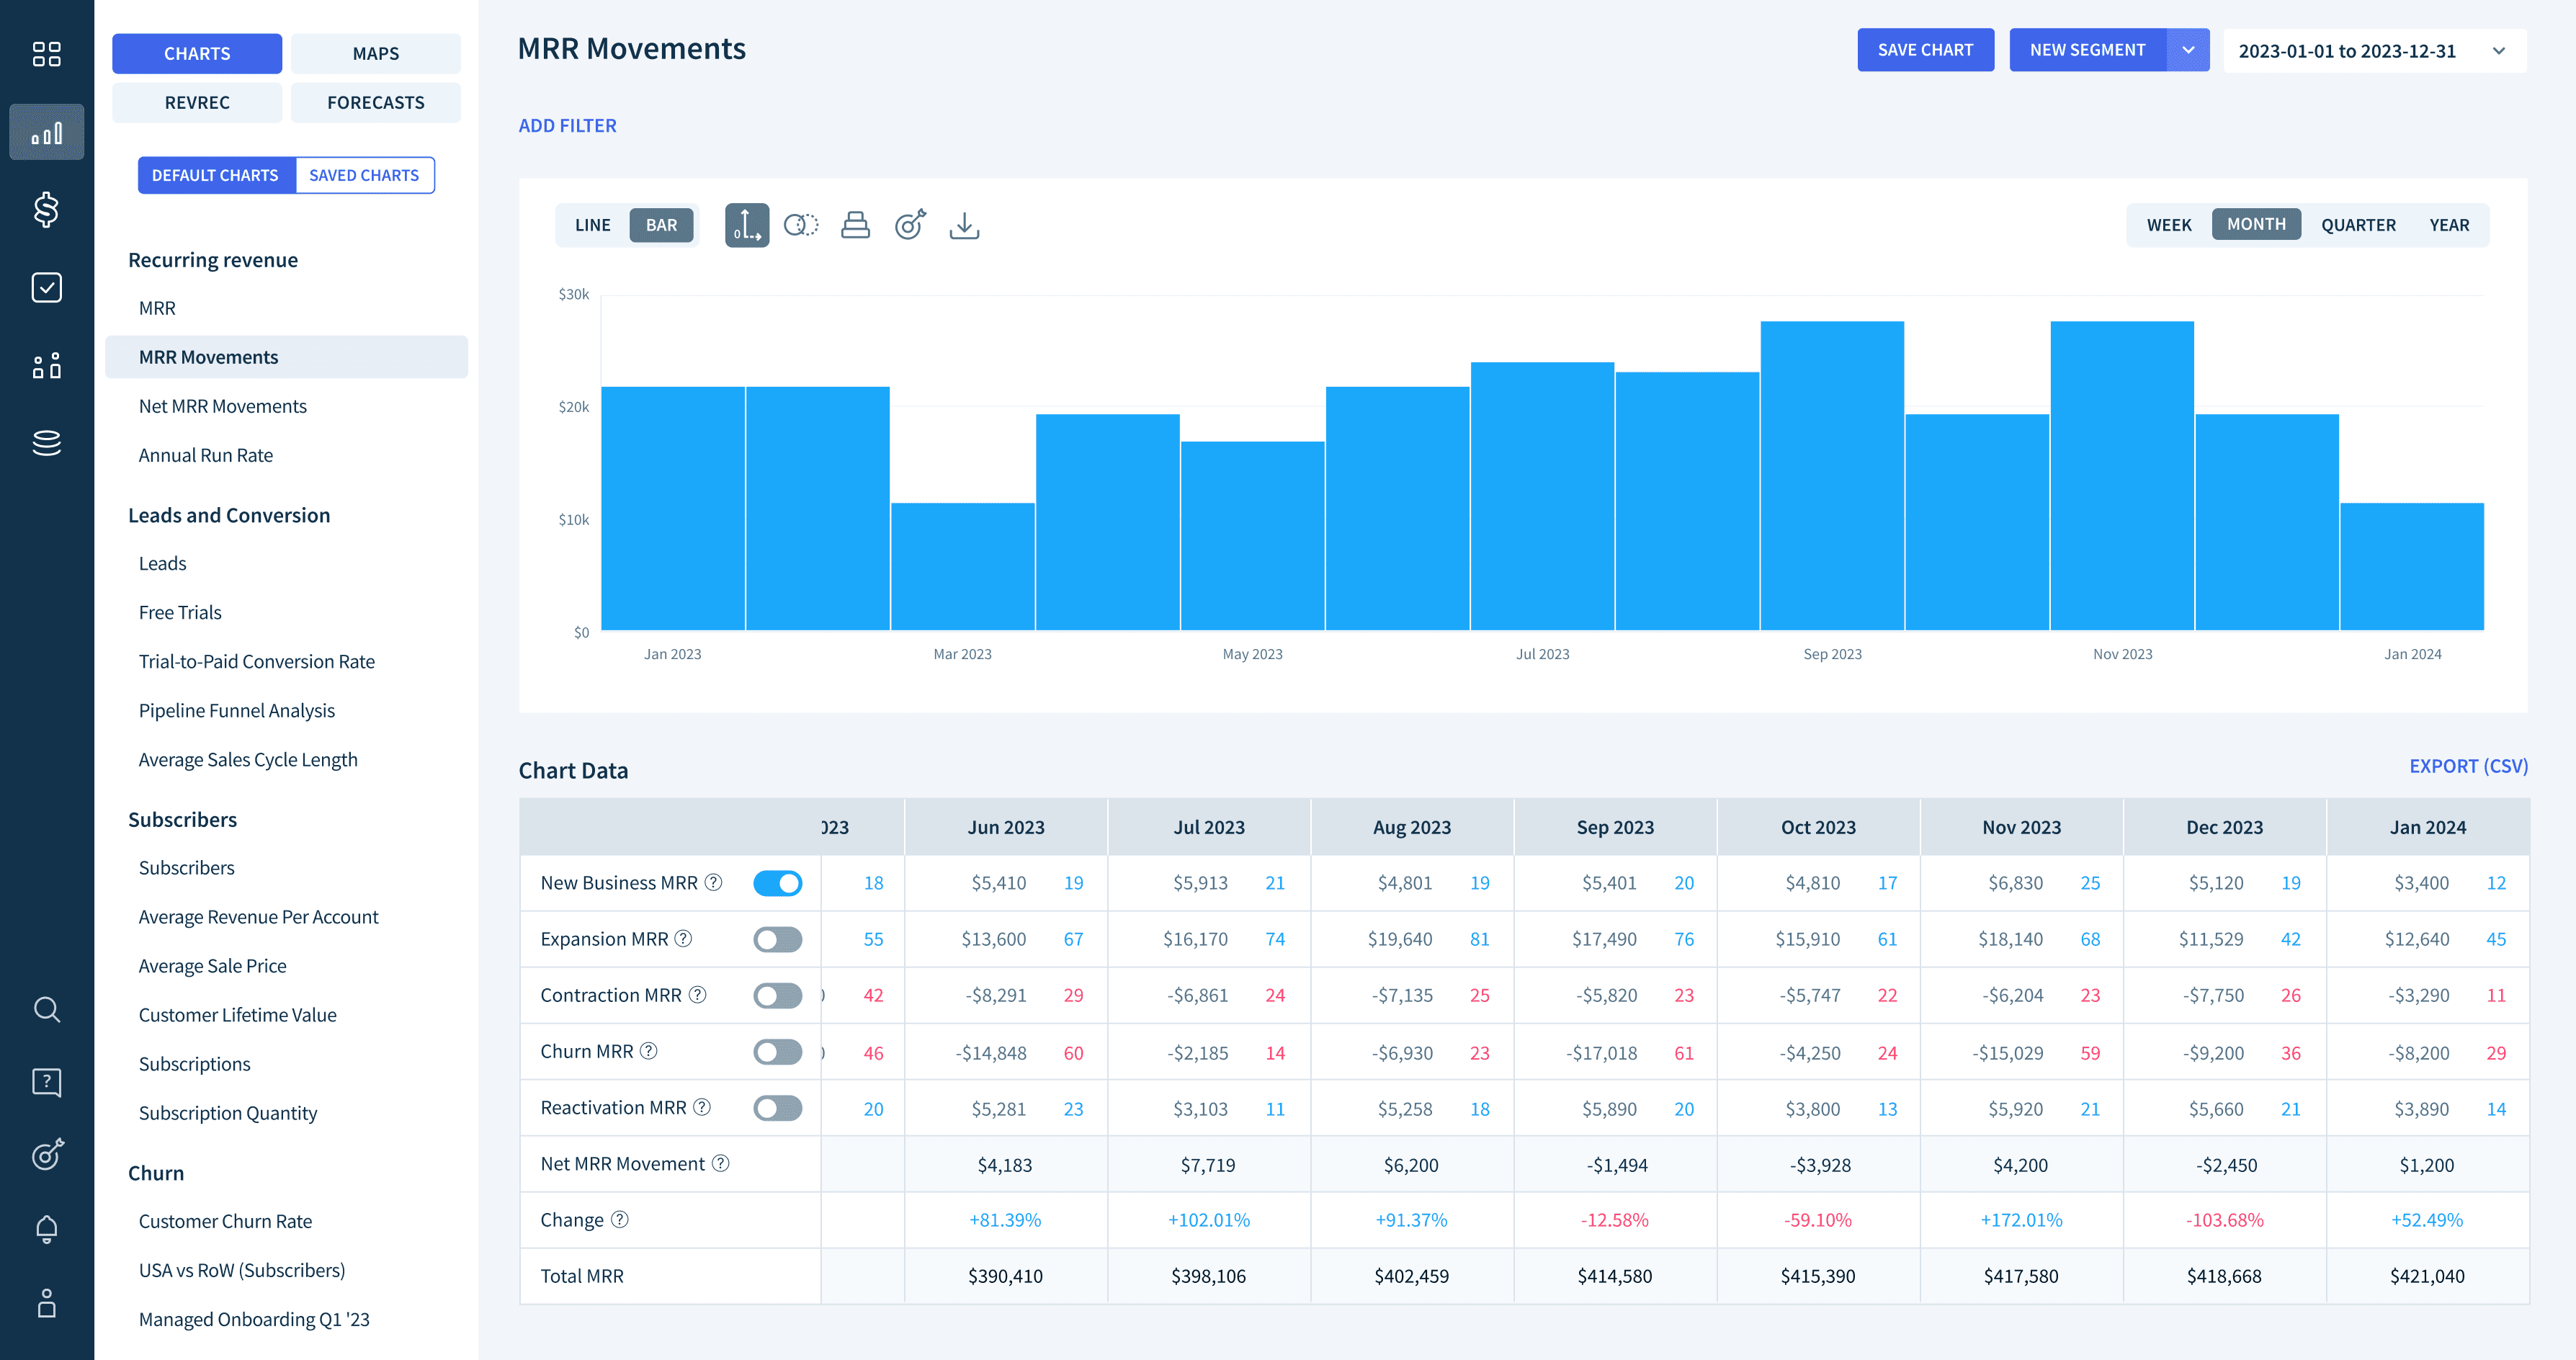
Toggle button
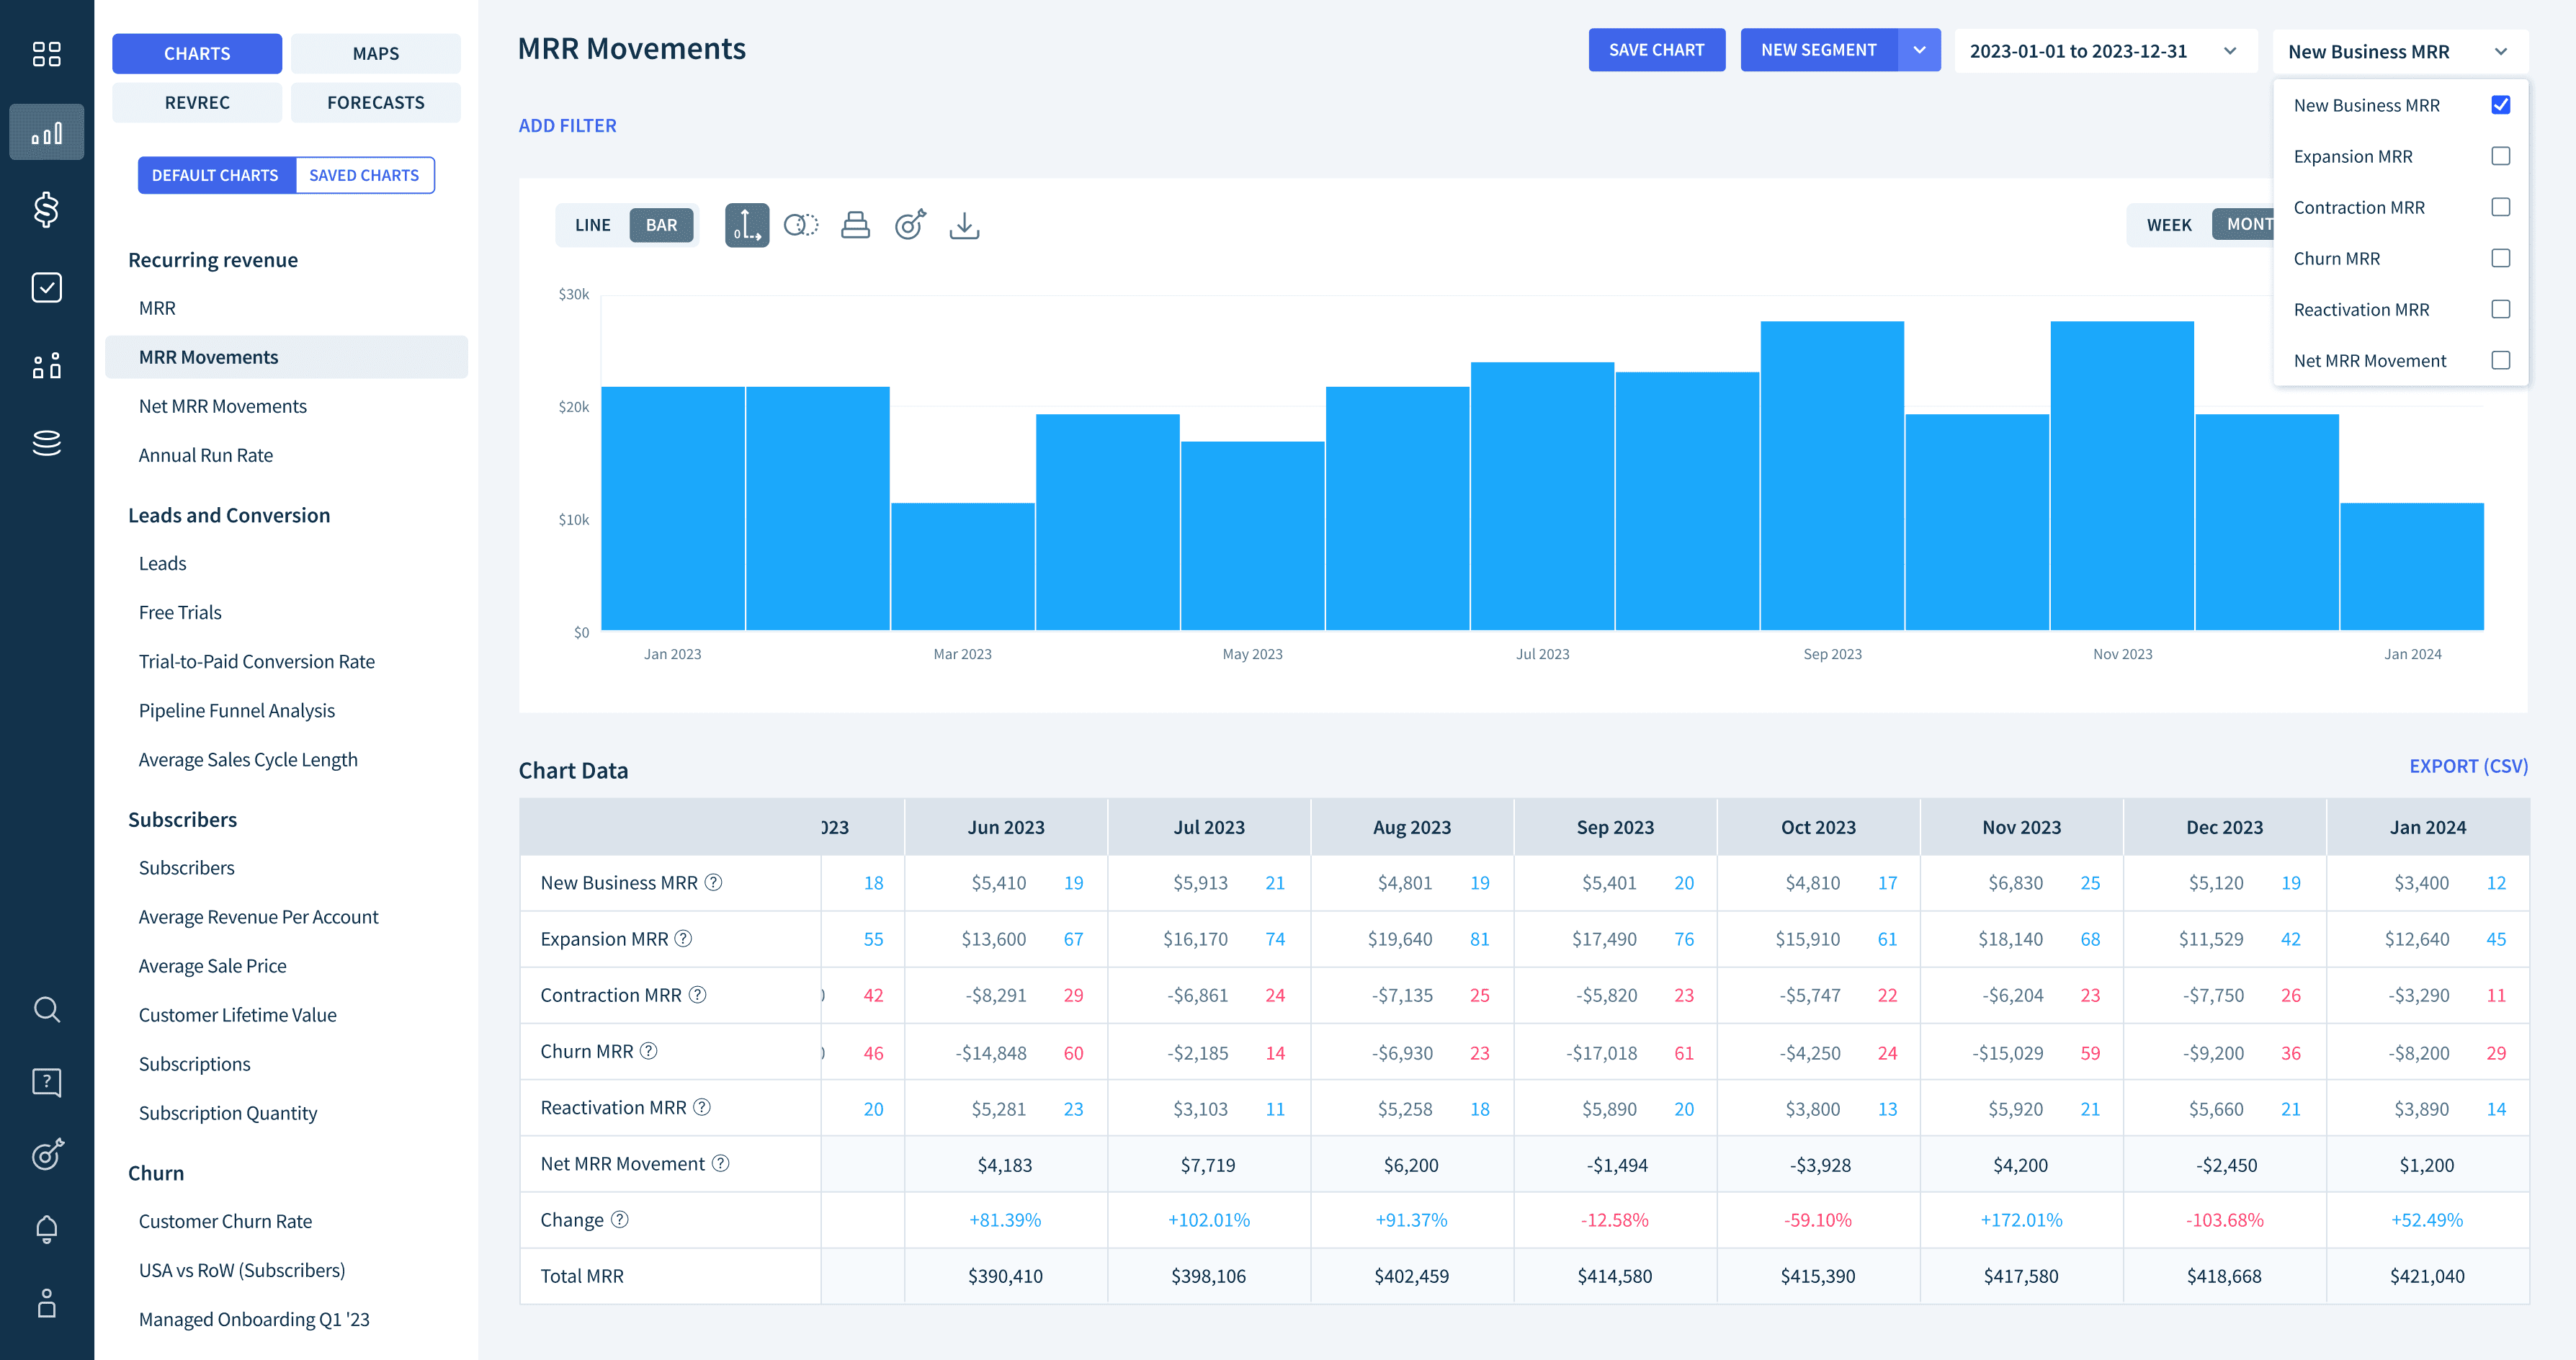
Dropdown on the chart
Populating from the bottom of chart
This approach makes it easier to analyze the chart trend as it provides clear differentiation in heights for each isolated movement.
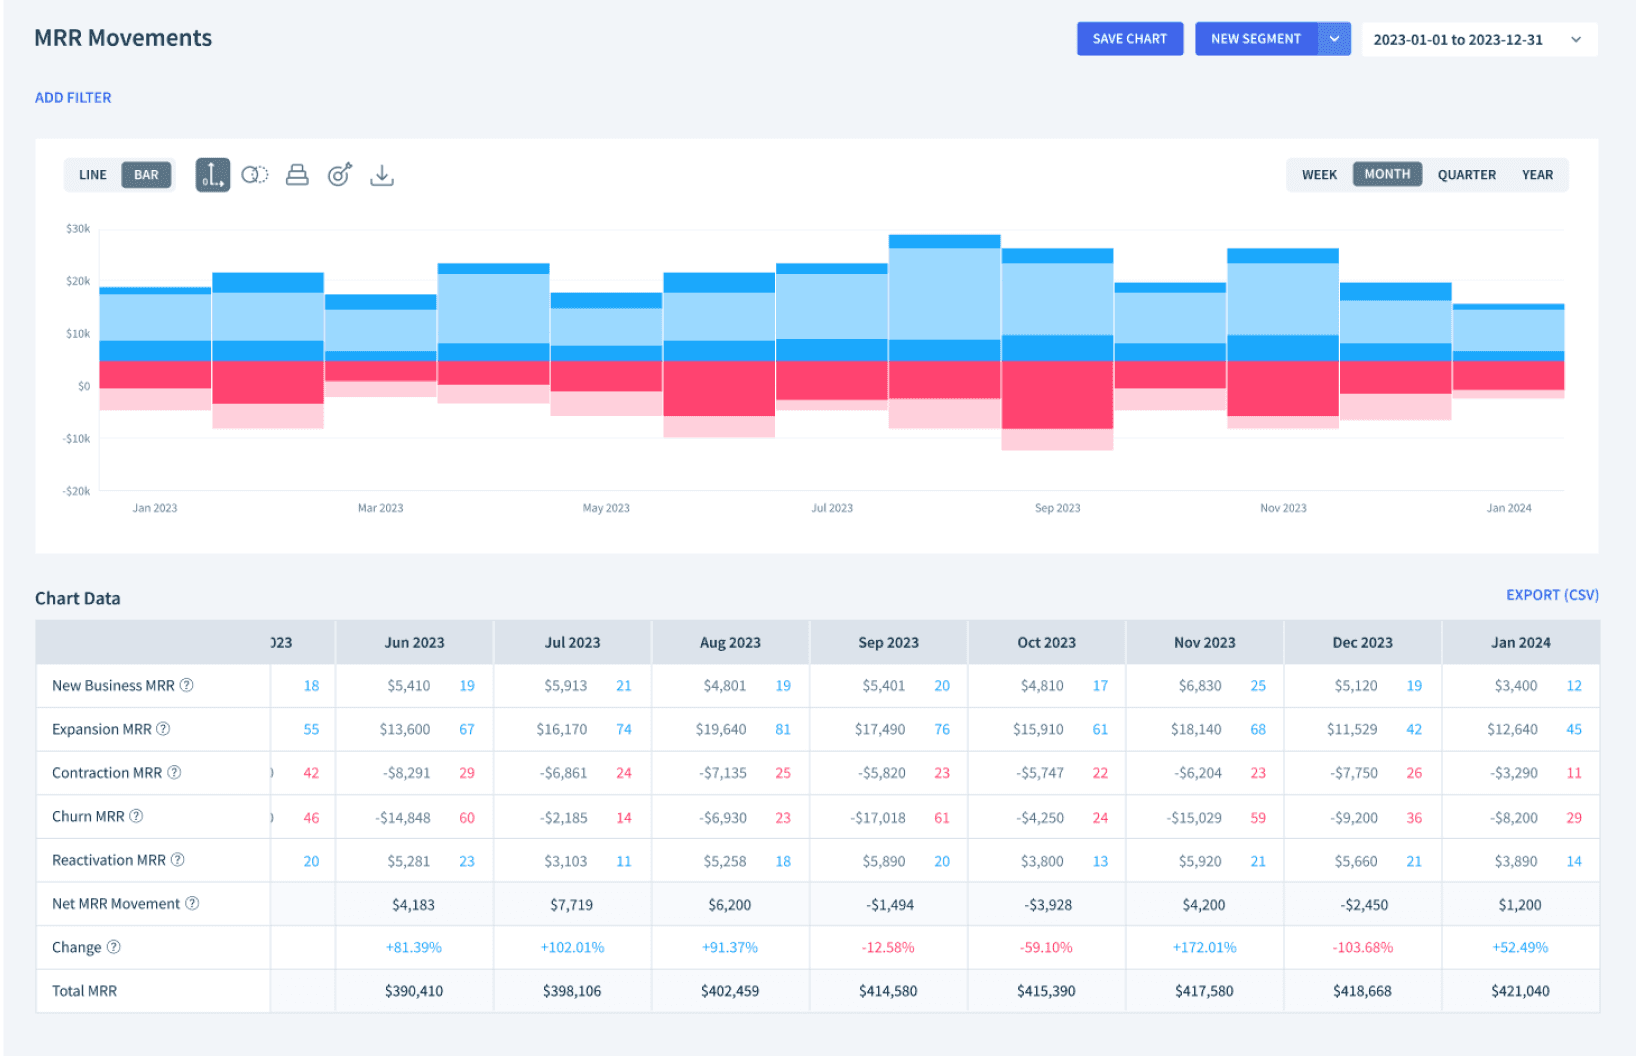
Populating from the middle
With this option, the movement bars remain static regardless of which movements the users turn on. This provides a consistent visual representation of the movements without moving effects, allowing users to focus on comparing the data without distractions.
As is
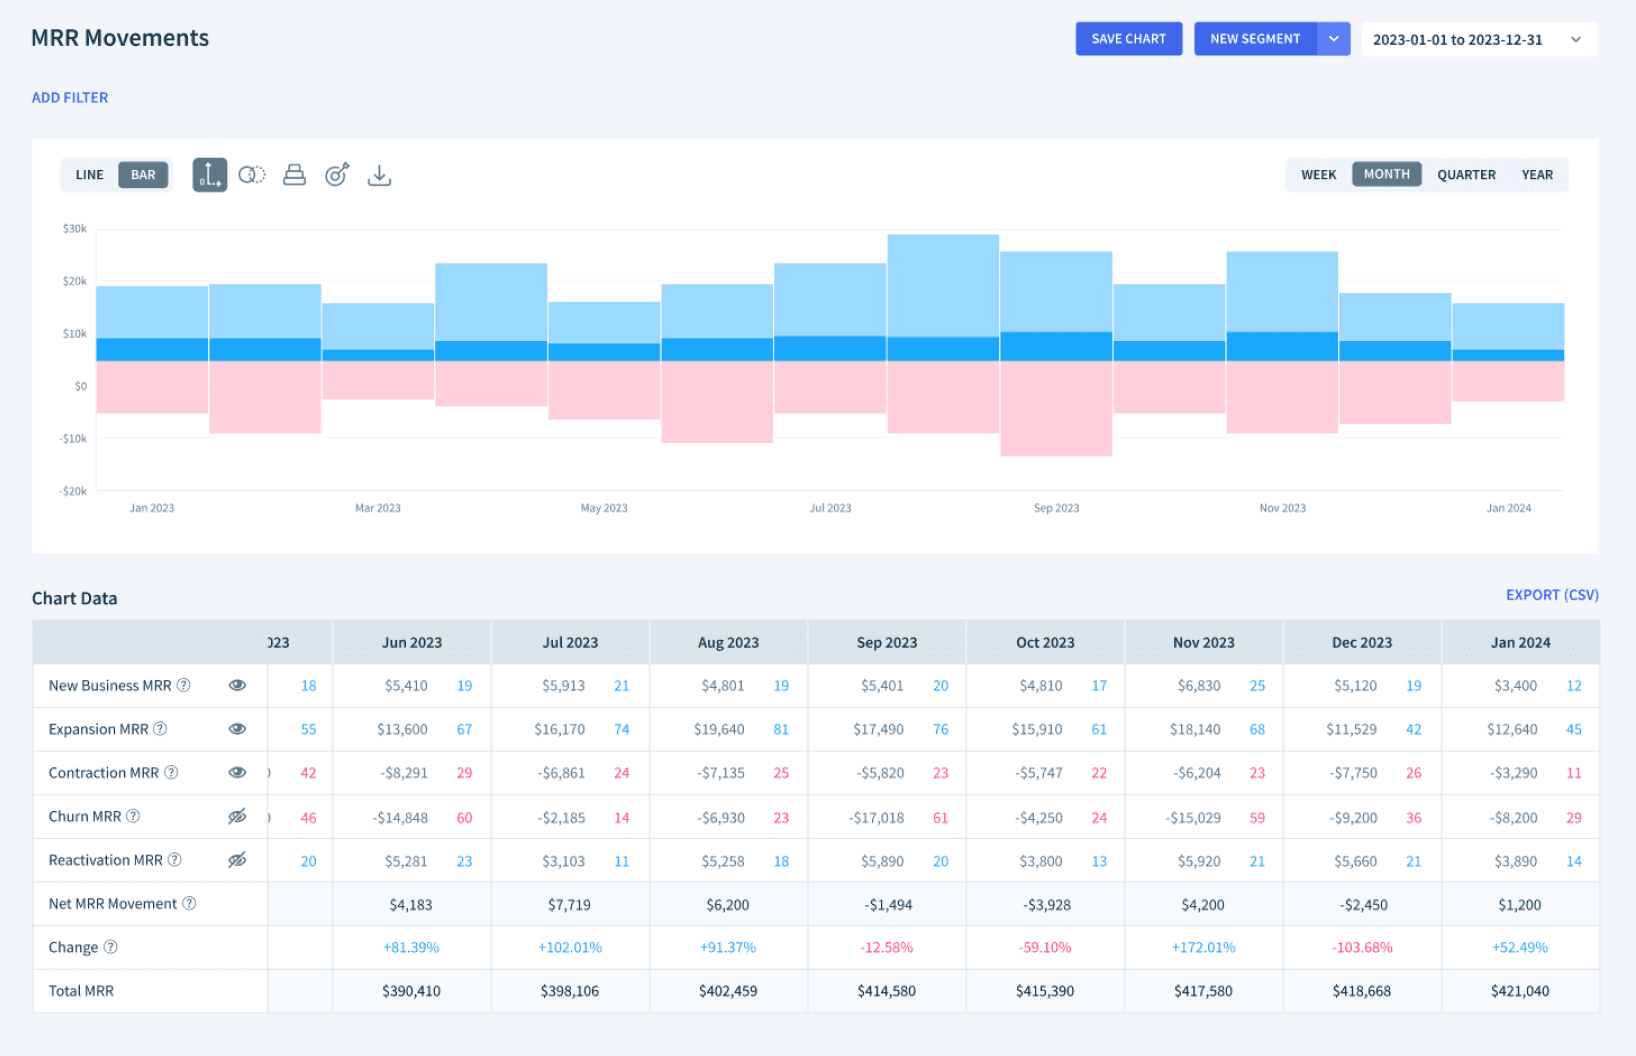
To be
Design Strategy
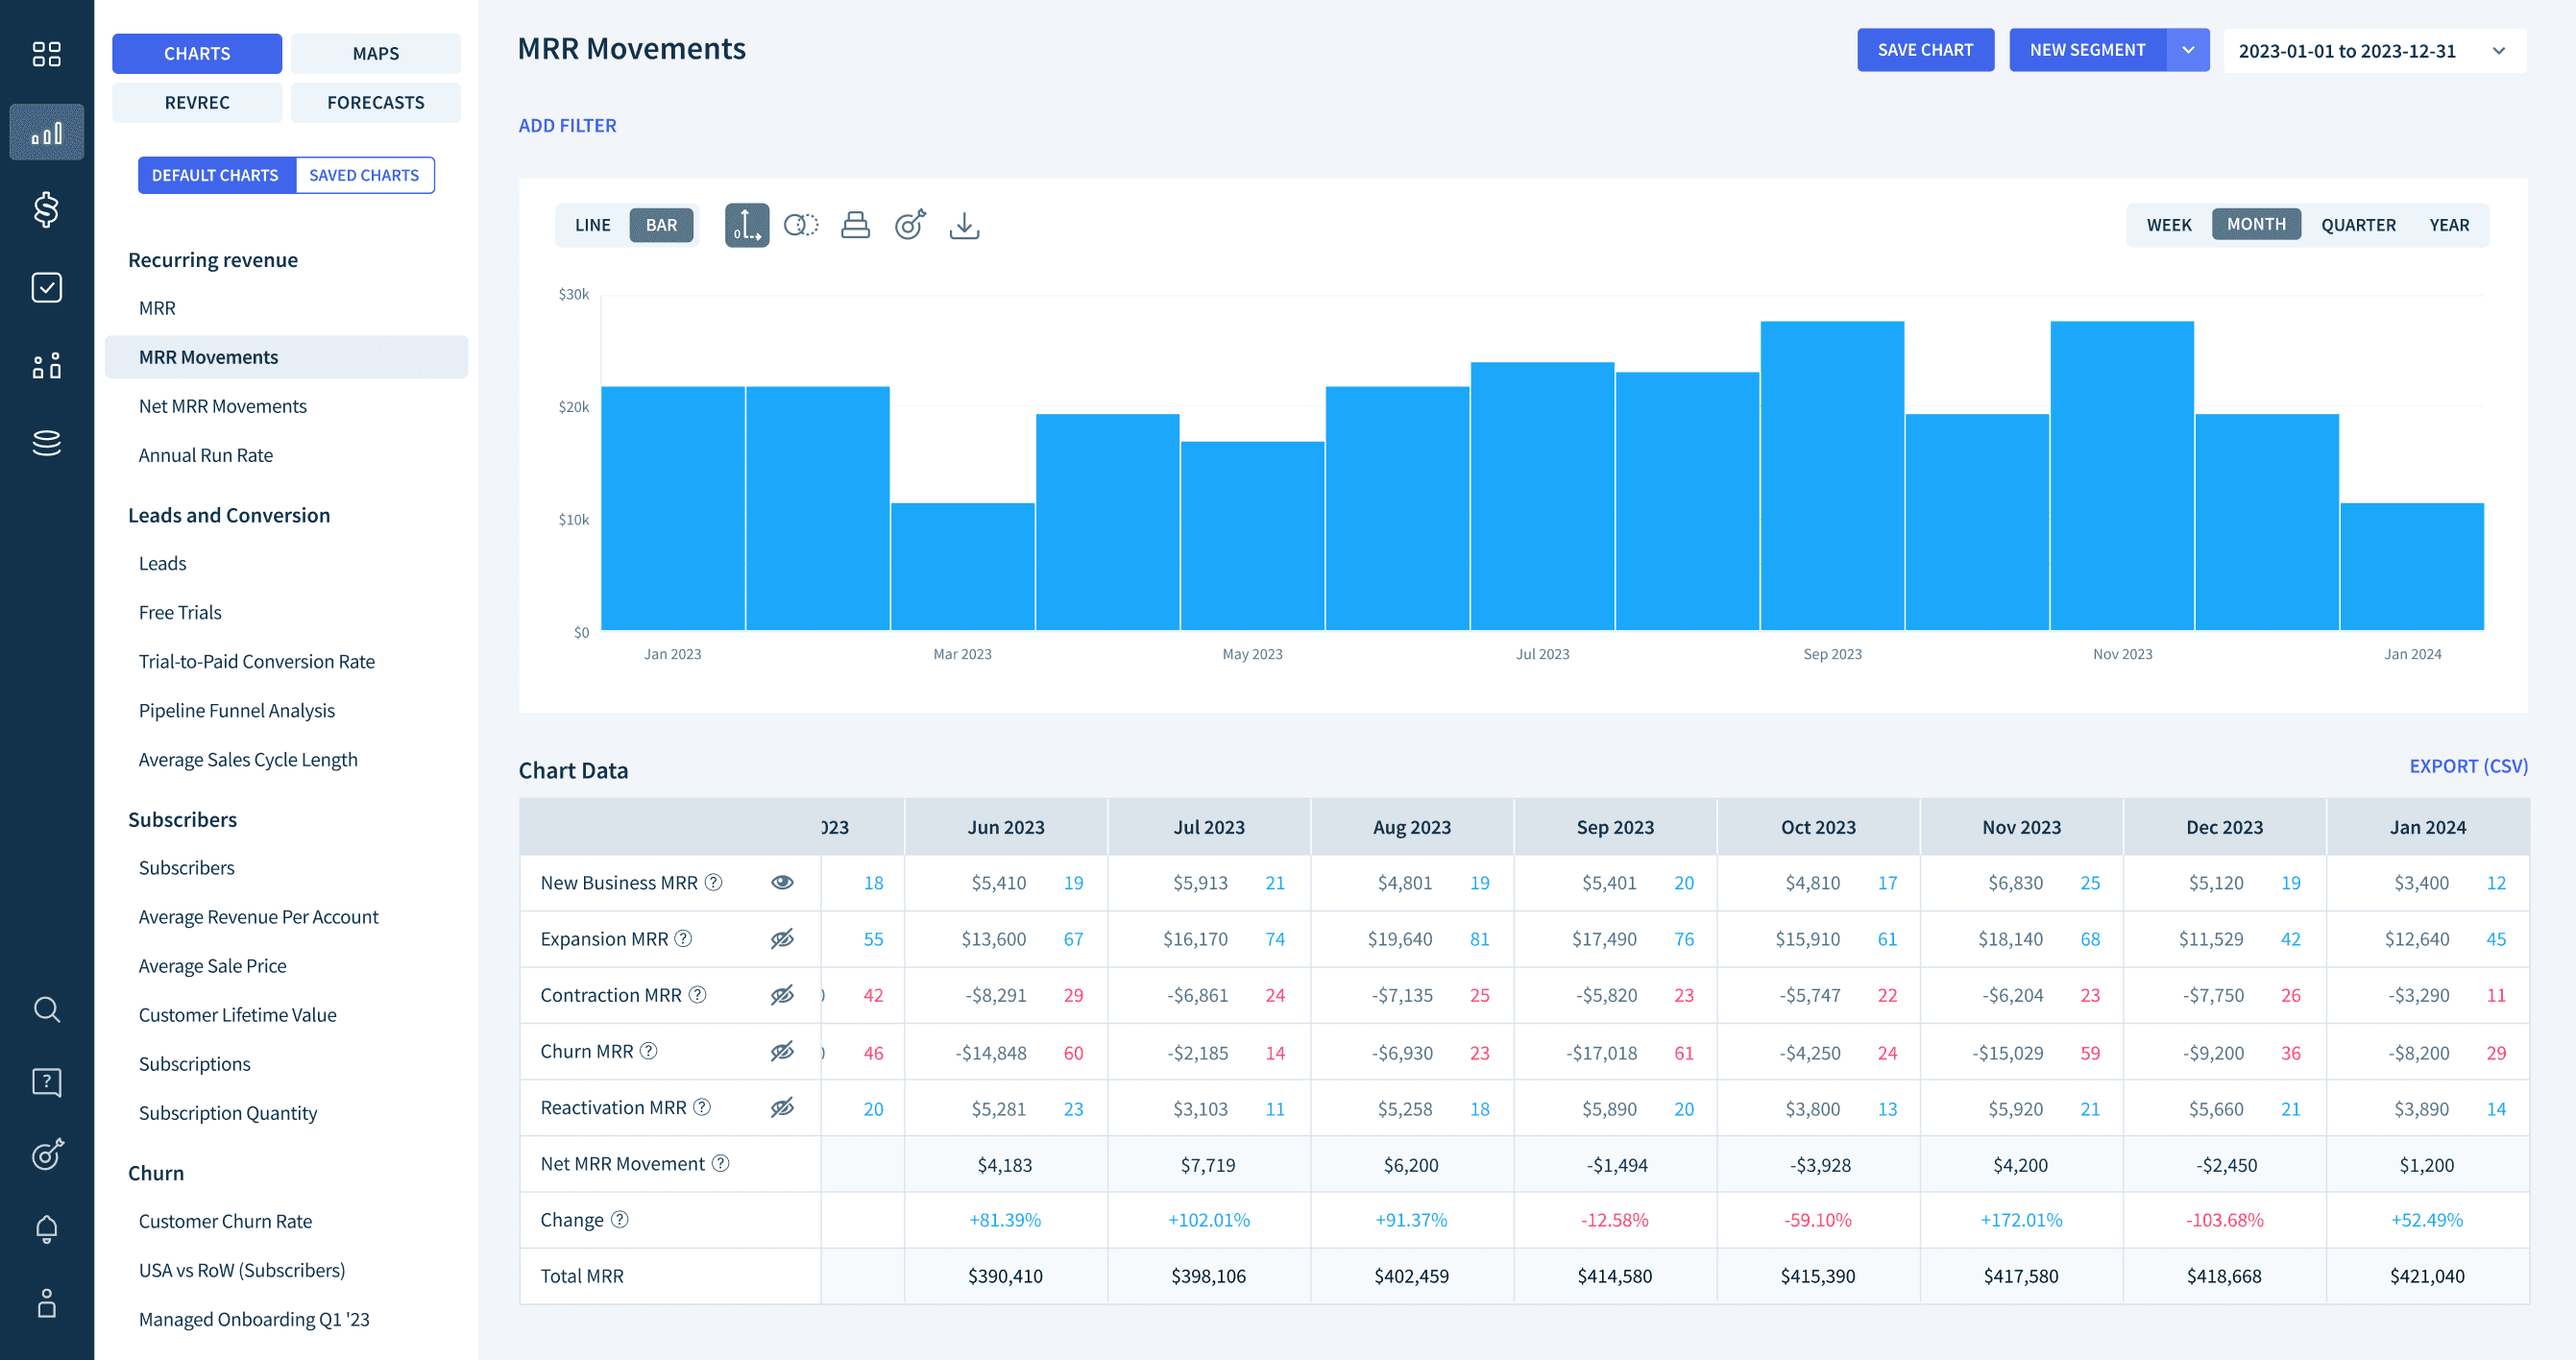
Enable users to customize MRR movement types by toggling the eye icon on/off.
We chose the eye-icon toggle — familiar, lightweight, and easy to use. It lets users customize the chart without disrupting the overall layout.
Implementation
How we handled edge cases
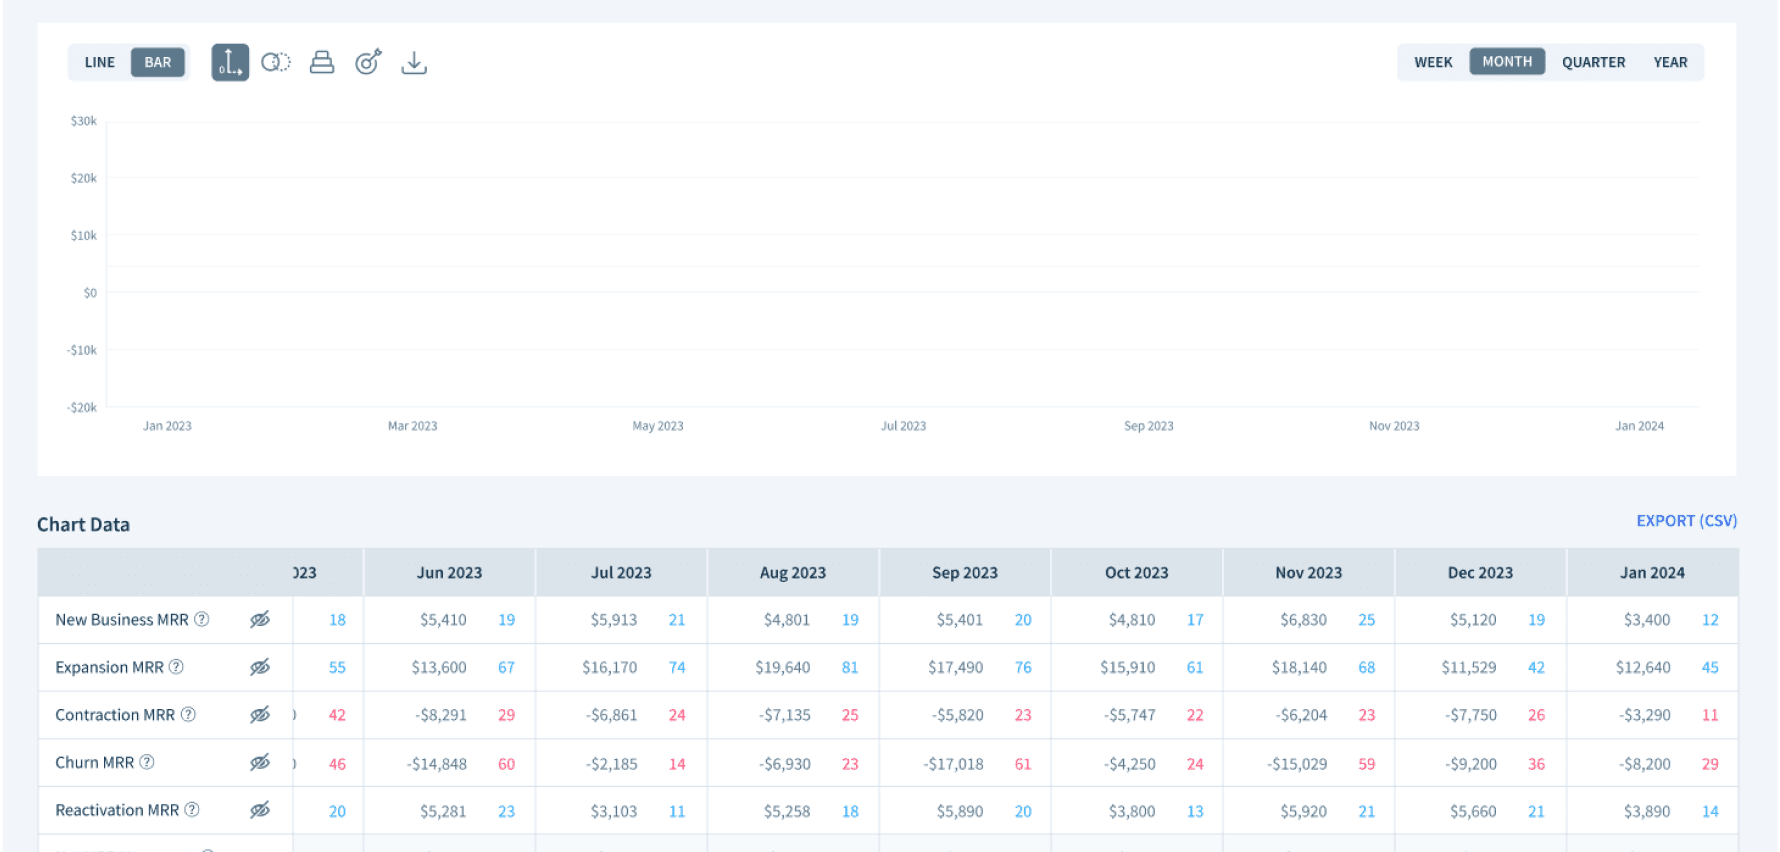
Case when all switches are off
While initially contemplating whether at least one MRR movement should be displayed, we decided to grant users the flexibility to turn off all movement types. This approach aligns with the anticipated user behavior and offers maximum customization.
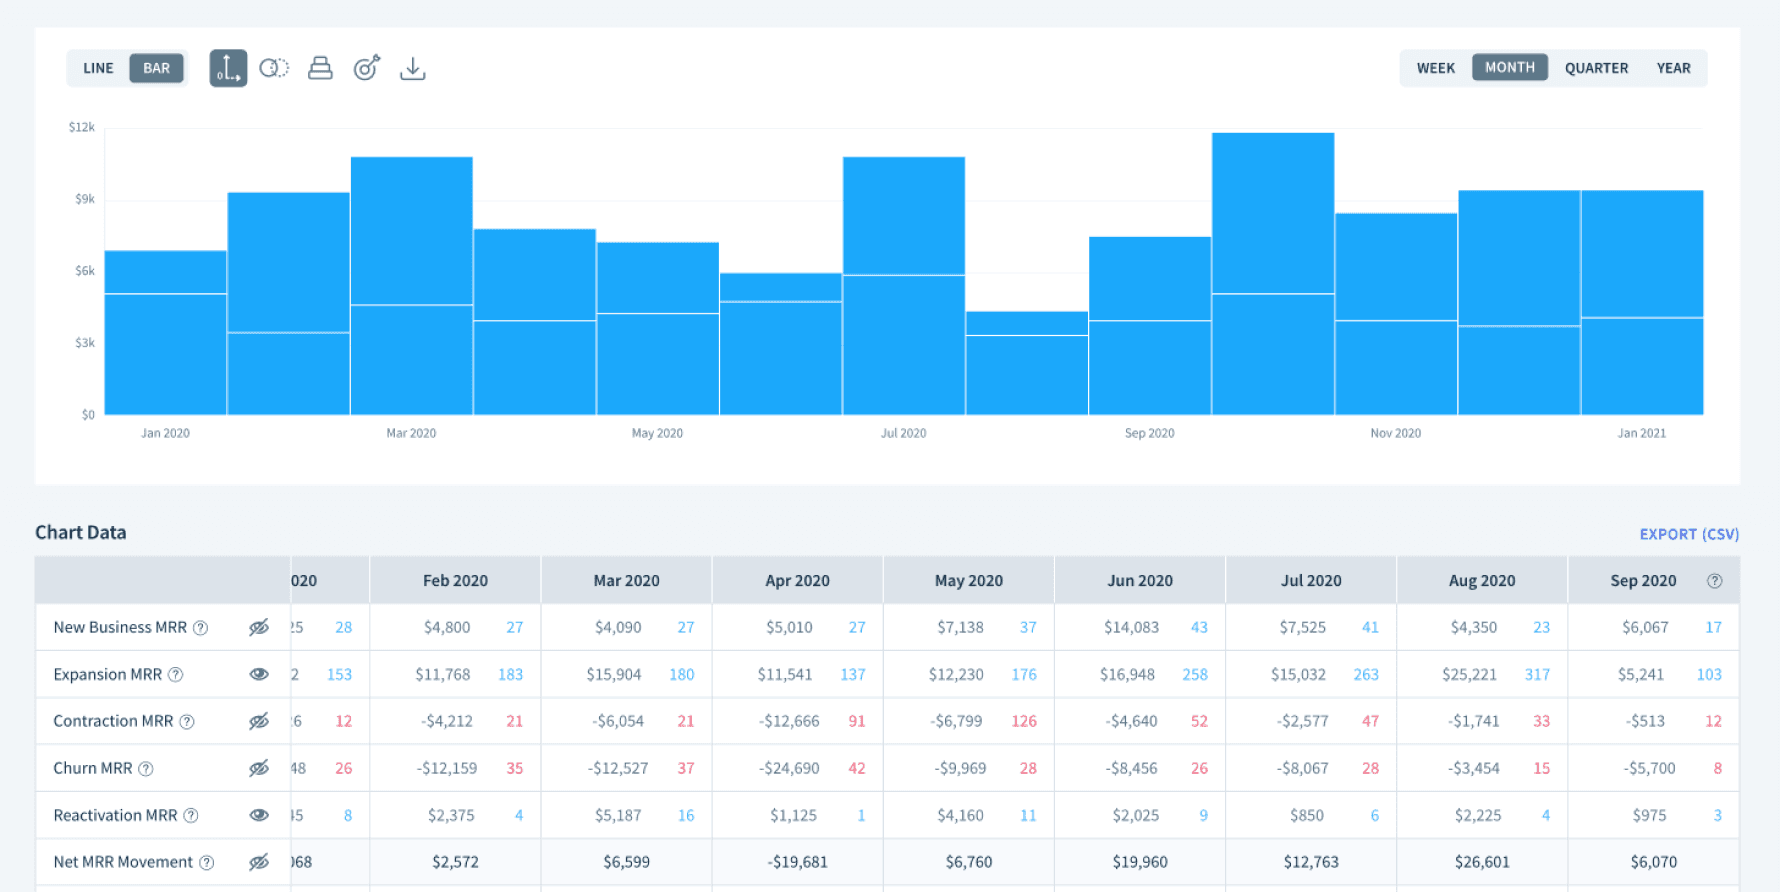
Distinguish MRR movement types
New Biz and Reactivation movements shared the same color, making them hard to distinguish. We considered adding a borderline but decided it could affect chart consistency across the app — so we prioritized the more common use cases instead.
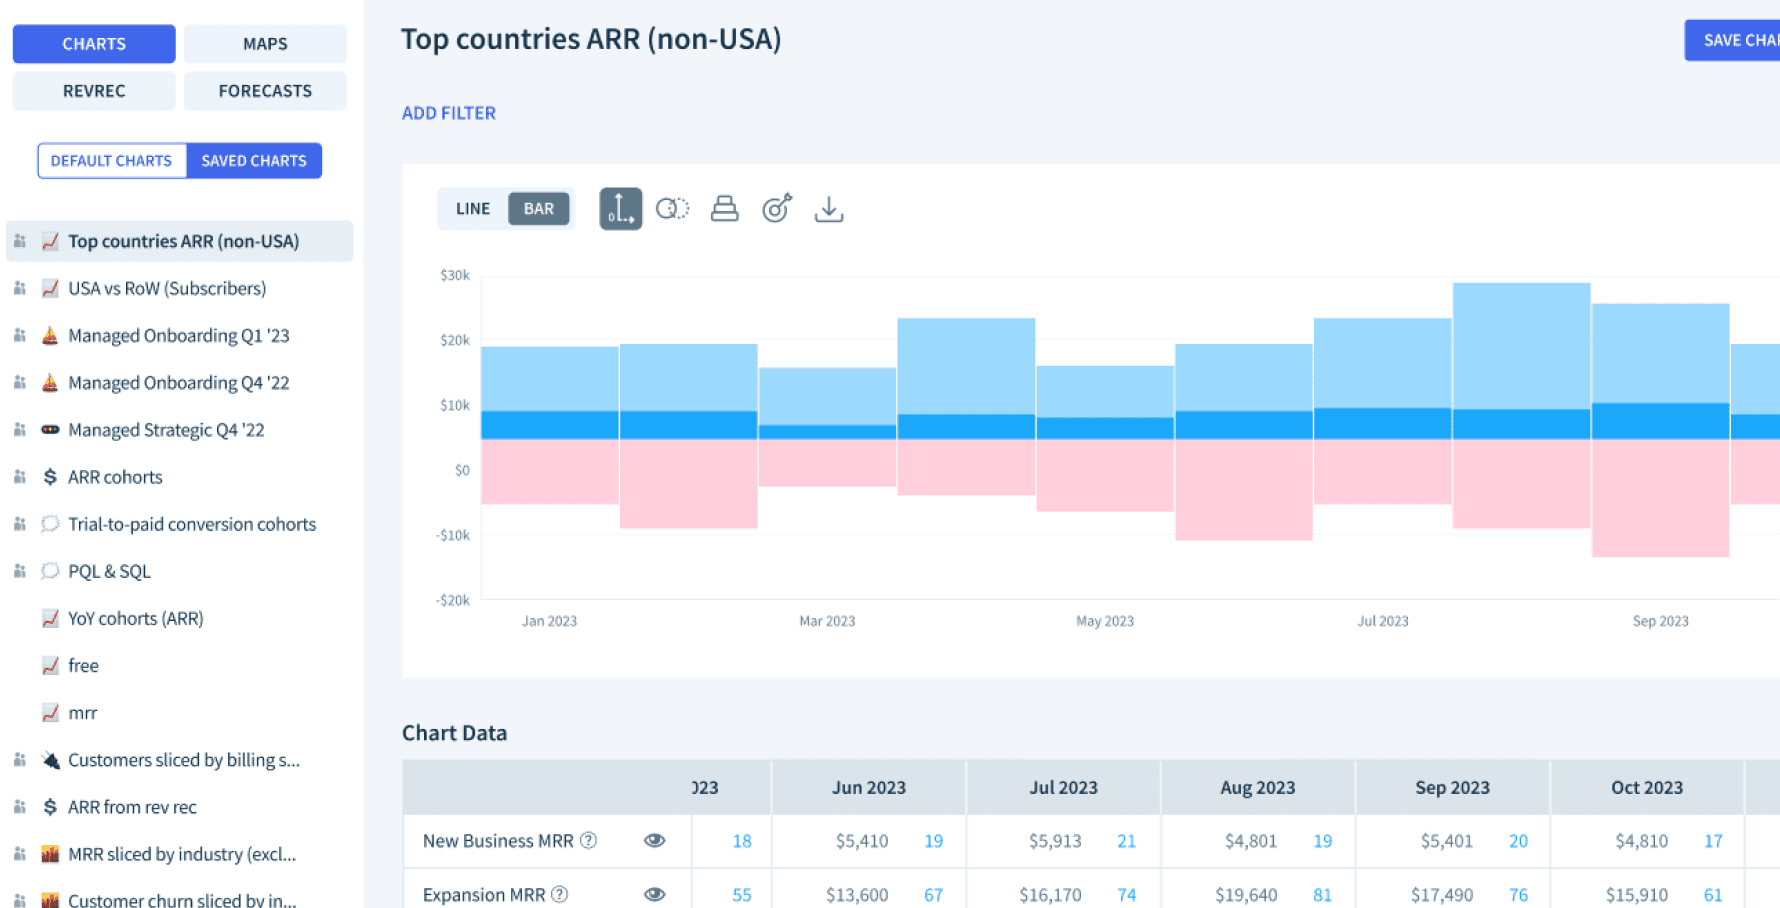
Enabling users to save the customized chart
For better accessibility and customization of charts, we implemented the ability to save MRR Movements chart with the customized view & filters. Users can easily find their customized chart with only one simple setup.
Deliver
After finalizing edge cases and QA, we shipped the feature.

Results - User feedback
The feature received positive responses on social media, and one user was inspired to build a Google Sheets plugin based on it.
Results - Statistics
We witnessed a 150% increase in the number of saved charts, and a 35% surge in the number of active users compared to the previous figures.
2 months before releasing
Last 2 months
Last 2 months
2 months before releasing
Takeaway
Experience of project management
I managed the end-to-end process (from problem definition to release coordination) which gave me a clearer picture of how design decisions translate into product timelines.
End-to-end design process
Presenting a new feature to internal teams taught me how to communicate design intent clearly across different functions.
Growing background knowledge of the product
Coming in with limited product context, I learned to ask better questions early, which helped me propose solutions that were more grounded in how users actually work.